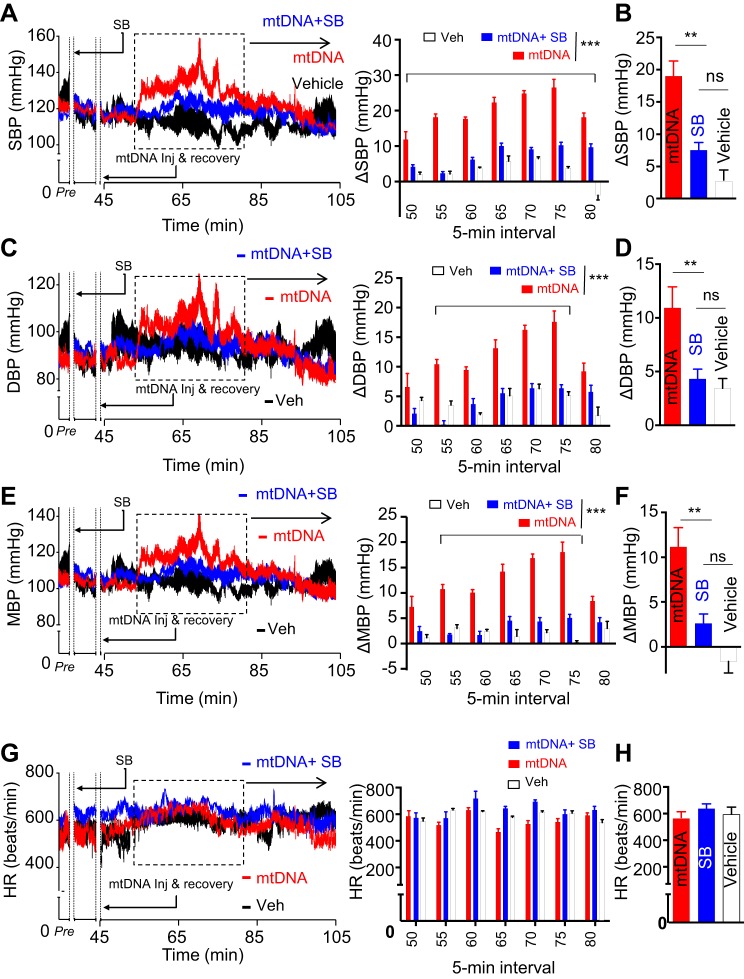
Fig. 6.
Centrally antagonizing TGFβ receptor suppresses mtDNA-induced hypertension. Standard C57BL/6 mice followed the same procedure as described in Fig. 2. After 1-wk postsurgery recovery, these mice were injected with a single dose of TGFβ receptor antagonist, SB-431542 (SB; 5 pmol) or/and mtDNA (60 pg) vs. vehicle (Veh) in the third ventricle, and systolic BP, diastolic BP, mean BP, and heart rate preinjection and postinjection were continuously recorded. The time period of 0–45 min was used for injection (inj) and postinjection recovery from the last injection (mtDNA injection). SBP (A and B), DBP (C and D), MBP (E and F), and HR (G and H) were recorded before injection and postinjection. A, C, E, and G: curves at left present the every-10-s average SBP (A), DBP (C), MBP (E), and HR (G) over a representative preinjection (Pre) period and a 1-h period after the injection in the rest phase. Bars at right present changes of postinjection in SBP (A), DBP (C), and MBP (E) compared with the preinjection baseline and heart rate (G) over duration segment of 5-min intervals for the time period outlined on the curves. B, D, F, and H: bars show 30-min peak changes (Δ) of SBP (B), DBP (D), and MBP (F) compared with the preinjection baseline and heart rate (H) in indicated groups. SBP, systolic BP; DBP, diastolic BP; MBP, mean BP; HR, heart rate; ns, nonsignificant, *P < 0.05, **P < 0.01, ***P < 0.001, compared between indicated groups; n = 6 mice per group. Error bars reflect means ± SE.

