Fig. 7.

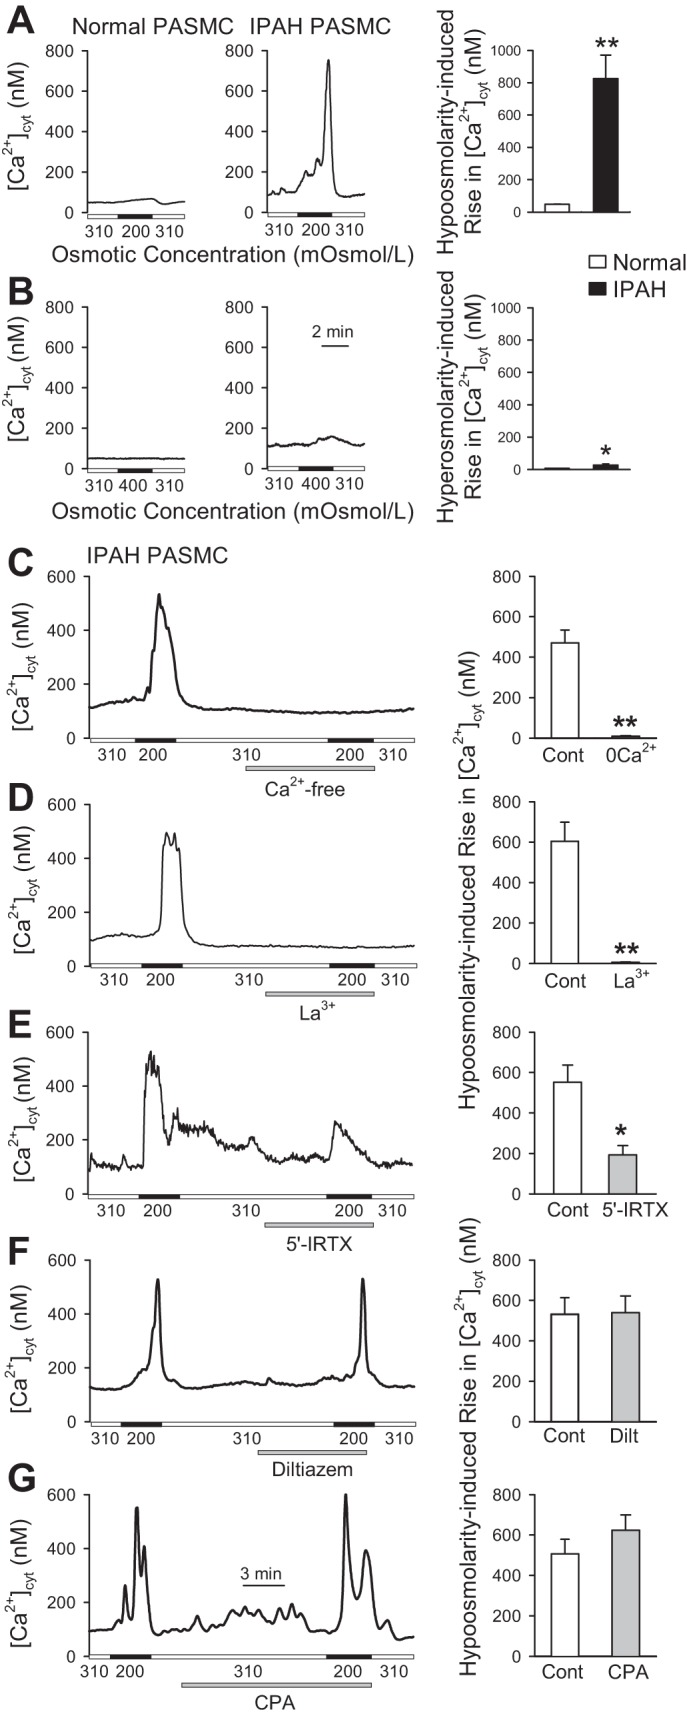
Osmotic stretch-induced increase in [Ca2+]cyt is increased in IPAH PASMCs partially through 5′-IRTX-sensitive TRPV1 channels. A: representative traces showing the changes in [Ca2+]cyt before, during (solid horizontal bars), and after application of hypotonic (200 mOsml/kg) solution in normal and IPAH PASMCs. Summarized data (means ± SE, right) showing the amplitude of hypo-osmolality (200 mOsml/kg)-mediated increase in [Ca2+]cyt in normal and IPAH PASMCs (n = 3 separate experiments). **P < 0.01 vs. normal. B: representative trace showing changes in [Ca2+]cyt before, during (solid horizontal bars) and after application of hypertonic (400 mOsml/kg) solution in normal and IPAH PASMCs. Summarized data (means ± SE, right) showing the amplitude of hyperosmolality (400 mOsml/kg)-mediated increase in [Ca2+]cyt in normal and IPAH PASMCs (n = 3 separate experiments). *P < 0.05 vs. normal. C: representative trace (left) showing the changes in [Ca2+]cyt in IPAH PASMCs before, during, and after application of hypotonic (200 mOsml/kg) solution in the presence or absence of extracellular Ca2+. Summarized data (means ± SE, right) showing the amplitude of hypo-osmolality-mediated increases in [Ca2+]cyt in IPAH PASMCs superfused with control solution containing 1.8 mM Ca2+ or Ca2+-free solution (n = 3 separate experiments). **P < 0.01 vs. control. D–G: representative traces showing the changes in [Ca2+]cyt in IPAH PASMCs before, during, and after application of hypotonic (200 mOsml/kg) solution in the absence or presence of 100 µM La3+ (D), 300 nM 5′-IRTX (E), 10 µM diltiazem (F), or 10 µM cyclopiazonic acid (CPA) (G). Summarized data (means ± SE) on right showing the amplitude of hypo-osmolarity-mediated increases in [Ca2+]cyt in IPAH PASMCs before (Cont), during, and after application of hypotonic (200 mOsml/kg) solution without or with the treatment of La3+ (D), 5′-IRTX (E), diltiazem (F), or CPA (G) (n = 3 separate experiments for each). *P < 0.05 and **P < 0.01 vs. control.
