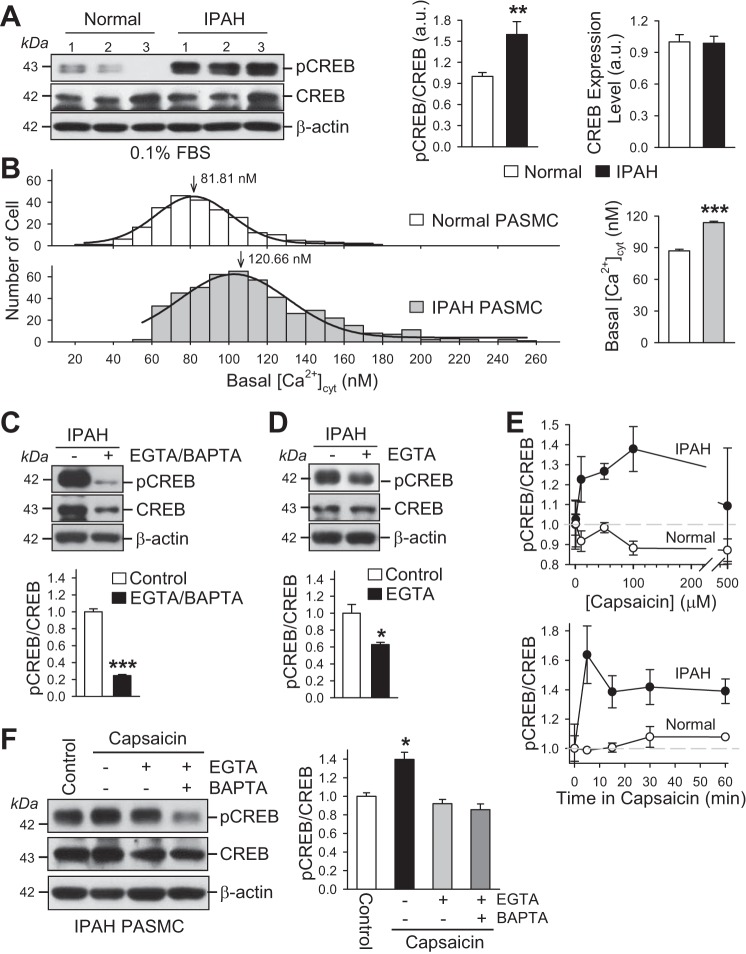
Fig. 9.
Increased phosphorylation of CREB is associated with high basal [Ca2+]cyt and a capsaicin-induced increase in [Ca2+]cyt in IPAH PASMCs. A: Western blot analysis of phosphorylated CREB (pCREB) and total CREB (CREB) in normal PASMCs and IPAH PASMCs cultured in low serum (0.1% FBS) media (left). Summarized data (means ± SE) showing the ratio of pCREB to total CREB (pCREB/CREB) (middle) and protein level of total CREB (CREB) (right) in normal and IPAH PASMCs (n = 3). **P < 0.01 vs. normal PASMCs. B: histogram showing the distribution of basal [Ca2+]cyt in normal PASMCs (open bars) and IPAH PASMCs (dark gray bars). The peak values of basal [Ca2+] are 81.94 and 120.66 nM in normal and IPAH PASMCs, respectively. Summarized data (means ± SE) showing the average basal [Ca2+]cyt in normal (n = 300 cells) and IPAH (n = 600 cells) PASMCs (right). ***P < 0.001 vs. normal PASMCs. C: Western blot analysis of pCREB and CREB in IPAH PASMCs treated with (+EGTA/BAPTA) or without (−EGTA/BAPTA) 2 mM EGTA and 30 µM BAPTA-AM for 24 h (top). Summarized data (means ± SE, bottom) showing the averaged pCREB/CREB ratios in control IPAH PASMCs and IPAH PASMCs treated with EGTA and BAPTA-AM (+EGTA/BAPTA) (n = 3). ***P < 0.001 vs. control IPAH PASMCs. D: Western blot analysis of pCREB and CREB in IPAH PASMCs treated with (+EGTA) or without (−EGTA) 2 mM EGTA for 24 h (top). Summarized data (means ± SE, bottom) showing the averaged pCREB/CREB ratios in control IPAH PASMCs and IPAH PASMCs treated with EGTA (n = 3). *P < 0.05 vs. control IPAH PASMCs. E: dose-response curves (top) and the time-course curves (bottom) for capsaicin-induced changes in pCREB/CREB ratio in normal and IPAH PASMCs (n = 3). Data are presented as means ± SE. The time for each dose of capsaicin was 15 min for the dose-response experiment, and the dose for each time of capsaicin treatment was 50 µM for the time-course experiment (n = 3). Data are presented as means ± SE. F: Western blot analysis of pCREB and CREB in IPAH PASMCs treated with 50 µM capsaicin in the absence (−) or presence (+) of 2 mM EGTA or EGTA plus 30 µM BAPTA-AM for 15 min (left). Summarized data (means ± SE, right) showing the averaged pCREB/CREB ratios in control IPAH PASMCs and IPAH PASMCs treated with capsaicin in the absence or presence of EGTA or EGTA plus BAPTA-AM (n = 3). *P < 0.05 vs. control IPAH PASMCs and IPAH PASMCs treated with EGTA/BAPTA or EGTA.

