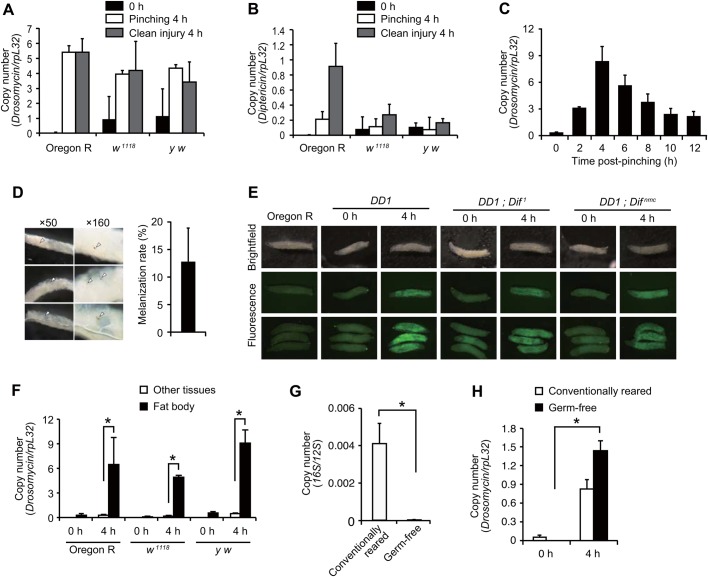
Fig. 2.
Characterization of antimicrobial peptide induction following pinching larvae with forceps. (A-C) Real-time qPCR analysis of Drs expression (A,C) or Dpt expression (B) upon clean injury or pinching larvae with forceps at the indicated time points with larvae of Oregon R, w1118 and y w. Pinching was performed with larvae of w1118 in C. (D) Melanization spots after pinching larvae with forceps after 4 h. The indicated magnification of the objective lens was used; arrowheads indicate melanization spots. The right bar graph shows the percentage of larvae that exhibited melanization spots. Data were analyzed by Student's t-test and values represent the means±s.e. of three independent experiments with 30 larvae each. (E) Drs-GFP reporter analysis using a fluorescence stereomicroscope upon pinching larvae with forceps after 4 h. Larvae of Oregon R, Drs-GFP Dpt-lacZ (DD1); c564-GAL4, DD1; Dif1 and DD1; Difnmc were used. Brightfield (top row) and fluorescence images (bottom 2 rows) of single larva or multiple larvae (bottom row); the green signal indicates GFP fluorescence. (F) Real-time qPCR analysis of Drs expression following pinching of Oregon R, w1118, and y w larvae with forceps at the indicated time points. The larval fat body was dissected out from other tissues. (G,H) Real-time qPCR analysis of bacterial genomic DNA coding for 16S rRNA, which was normalized by the Drosophila genomic region for 12S RNA from conventionally reared or germ-free Oregon R larvae before pinching (G), or of Drs expression following pinching larvae with forceps at 4 h with conventionally reared or germ-free Oregon R larvae (H). Data were analyzed by the Student's t-test and values represent the means±s.e. of three independent experiments with 10 larvae each (F,G). *P<0.05.

