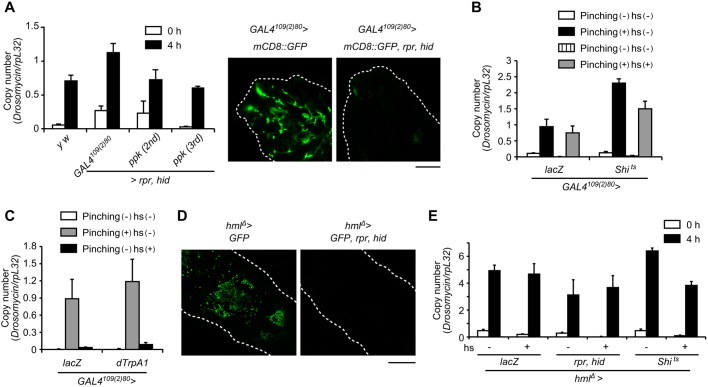
Fig. 4.
Sensory neurons and hemocytes are dispensable for the induction of Drs upon pinching. (A) Fluorescence microscopy (right) of larval sensory neurons around the mouth hook. Larvae of +/+; GAL4109(2)80 UAS-mCD8::GFP/+ and UAS-rpr UAS-hid/+; GAL4109(2)80 UAS-mCD8::GFP/+ were used. Green indicates the GFP signal and white dotted lines indicate the outlines of each larva. Scale bar: 100 µm. (A-C) Real-time qPCR analysis of Drs expression after pinching larvae with forceps for larvae of y w, UAS-rpr UAS-hid ; GAL4109(2)80 UAS-mCD8::GFP/+, UAS-rpr UAS-hid; ppk-GAL4/+ (second instar stage), UAS-rpr UAS-hid ;; ppk-GAL4/+ (third instar stage) at 0 or 4 h (A, left); larvae of UAS-lacZ/GAL4109(2)80 UAS-mCD8::GFP, UAS-Shits/GAL4109(2)80 UAS-mCD8::GFP, with or without pinching and with or without heat shock at 30°C for 4 h (hs) (B); larvae 4 h after treatment in UAS-lacZ/GAL4109(2)80 UAS-mCD8::GFP, UAS-Shits/GAL4109(2)80 UAS-mCD8::GFP, with or without pinching or heat shock treatment at 37°C for 2 min (hs) (C). Data are representative of at least two independent experiments and were analyzed by the Student's t-test; values represent the means±s.e. of triplicate samples with 10 larvae each. (D) Fluorescence microscopy observation of larval hemocytes. Larvae of hmlΔ-GAL4 UAS-2×EGFP/UAS-lacZ, and UAS-rpr UAS-hid/+; hmlΔ-GAL4 UAS-2×EGFP/+ were used. Green indicates the GFP signal and white dotted lines indicate the outlines of each larva. Scale bar: 200 µm. (E) Real-time qPCR analysis of Drs expression at 4 h after pinching larvae with forceps of hmlΔ-GAL4 UAS-2×EGFP/UAS-lacZ, UAS-rpr UAS-hid/+; hmlΔ-GAL4 UAS-2×EGFP/+, hmlΔ-GAL4 UAS-2×EGFP/+; UAS-Shits/+, with or without pinching or treatment at 29°C for 2 days (hs). Data are representative of at least two independent experiments and were analyzed by the Student's t-test; values represent the means±s.e. of triplicate samples with 10 larvae each.

