Fig. 5.
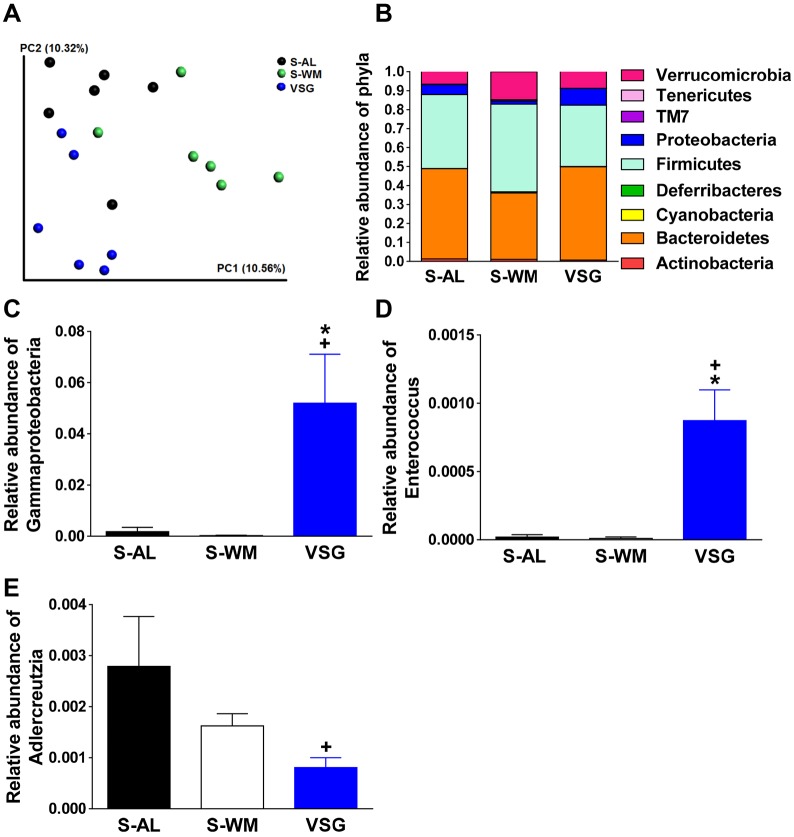
VSG produces shifts in cecal microbial profiles. Gut microbial profiles were determined in cecal content samples collected 2.5 months after surgery. (A) Principal coordinate analysis plots of unweighted UniFrac distances. (B) Relative abundance of bacterial phyla. Relative abundance of Gammaproteobacteria (C), Enterococcus (D), and Adlercreutzia. (E). Relative abundances are expressed as a percentage of total 16S rRNA gene sequences. VSG, VSG-operated mice; S-AL, sham-operated ad libitum-fed mice; S-WM, sham-operated weight-matched mice. *P<0.05, compared with S-AL; +P<0.05, compared with S-WM. Data are expressed as mean±s.e.m.

