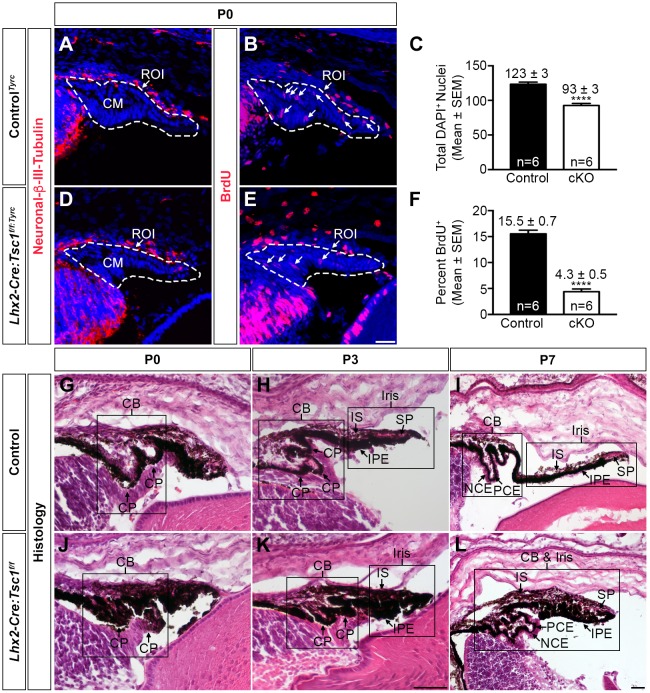
Fig. 7.
Conditional deletion of Tsc1 disrupts postnatal ciliary body and iris development. (A-F) CM proliferation rate analysis on coronal eye sections taken from controlTyrc (A,B) and Lhx2-Cre:Tsc1f/f:Tyrc (D,E) mice at P0. Immunohistochemical analysis for neuronal β-III-tubulin was used to define the NR and an ROI was drawn around the presumptive CM (A,D, dashed line). The number of DAPI+ cells was then quantified within this ROI. Lhx2-Cre:Tsc1f/f:Tyrc mice (cKO) had a significant reduction in the total number of DAPI+ cells within the CM at P0 when compared with control littermates (C). Immunohistochemical analysis for BrdU was performed on adjacent sections and the previously drawn ROI was used to define the CM (B,E, dashed line). The number of BrdU+ cells was then quantified within this ROI. This data was subsequently divided by the DAPI+ counts to determine the percentage of BrdU+ cells within the ROI. Lhx2-Cre:Tsc1f/f:Tyrc mice (cKO) had a significant reduction in the percentage of proliferating cells in the CM at P0 when compared with controlTyrc littermates (F). All quantification data are mean±s.e.m. (n=6 eyes for both controlTyrc and Lhx2-Cre:Tsc1f/f:Tyrc); ****P≤0.0001, calculated using an unpaired two-tailed Student's t-test. (G-L) Histological analysis of coronal eye sections taken from control (G-I) and Lhx2-Cre:Tsc1f/f (J-L) mice at P0 (G,J), P3 (H,K) and P7 (I,L). The CB and iris undergo gradual morphogenesis in control animals during the first postnatal week (G-I). The future CB is initially demarcated by the emergence of the ciliary processes at P0 (G). Further development of the ciliary processes coupled with IS and IPE extension in addition to the appearance of the SP is observed at P3 (H) and by P7, the overall structure of both the CB and iris are well defined (I). In contrast, the CB and iris fail to undergo morphogenesis during the first postnatal week in Lhx2-Cre:Tsc1f/f mice (J-L). This is best illustrated by the absence of well-defined ciliary processes at P0 (J) coupled with a failure of iris extension and SP development at P3 (K). This failure of morphogenesis eventually culminates in the hypotrophic appearance of both the CB and iris at P7 (L). Scale bars: 25 µm (A,B,D,E), 100 µm (G,H,J,K) and 200 µm (I,L).

