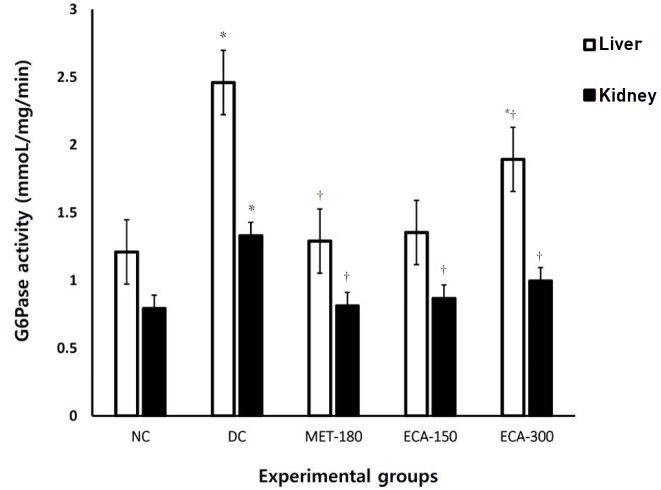
Fig. 7. Effects of ECA on the activity of G6Pase in liver and kidney samples. Results are represented as means ± SEMs. (*) and (†) indicate statistical significance (P < 0.05) in comparison with the NC and the DC, respectively.
G6Pase, glucose 6 phosphatase; NC, normal control; DC, diabetic control; MET, metformin; ECA, extract of Cassia abbreviata; SEMs, standard errors of the means.

