Fig. 2.
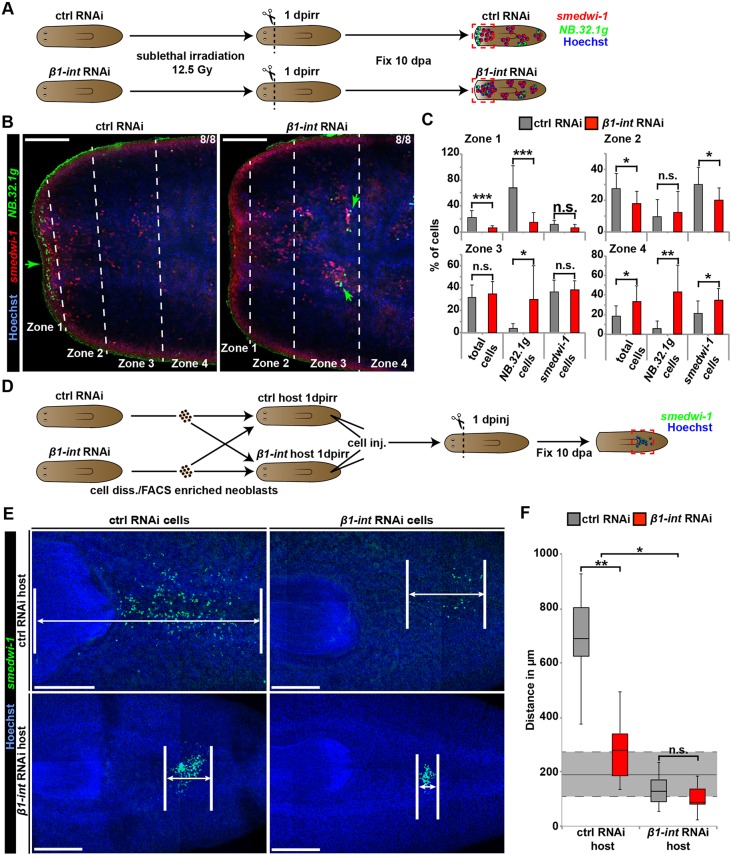
Impaired cell migration after β1-int RNAi. (A) Sublethal γ-irradiation assay with 12.5 Gy. See text for details. (B,C) Double FISH against smedwi-1 (red) and NB.32.1g (green) reveals a significant net shift of neoblasts and NB.32.1g+ progenitor cells (green arrows) towards the posterior in β1-int RNAi fragments 10 dpa. Fragments were segmented into four zones based on their distance from the anterior epidermis: Zone 1, up to 50 μm; Zone 2, 50-100 μm; Zone 3, 100-150 μm; Zone 4, >150 μm. The average percentage (+s.d.) smedwi-1+ and NB.32.1g+ cells out of the total cell number, of eight animals from each condition in every zone are plotted in C. (D) Cell transplantation assay. See text for details. (E,F) FISH against smedwi-1 (green) reveals a significant decrease in neoblast dispersion for all β1-int RNAi combinations. Average distances between anterior- and posterior-most neoblast of seven animals are plotted in F in boxplots. The dark horizontal lines within the boxes represent the median for each condition, with the box representing the 25th and 75th percentiles and the whiskers indicating minimum and maximum values. The gray area marks the average distance (permanent line: ∼193.2 µm; n=7 animals) of transplanted ctrl neoblasts in uncut ctrl animals with s.d. (dashed lines: ∼±81.8 µm; n=7 animals). The composite image in E was generated using the customized tile scan function of Zeiss AxioVision software. Statistical significance (Student's t-test) is indicated (*P≤0.05; **P≤0.01; ***P≤0.001). DNA is blue (Hoechst). dpinj, days post injection; dpirr, days post irradiation; Gy, gray. Scale bars: 100 µm (B); 250 µm (E).

