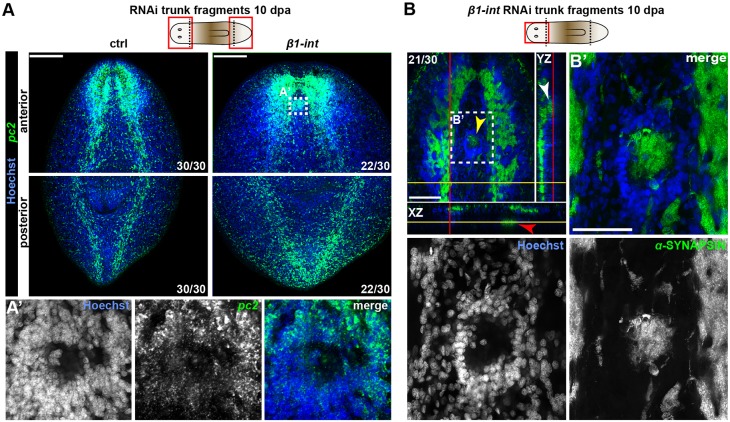
Fig. 4.
Ectosphere formation in anterior blastemas of β1-int RNAi planarians. (A,A′) FISH against pc2 (green) on ctrl and β1-int RNAi trunk fragments at 10 dpa. White box indicates magnified area shown in A′, from another z-position within the ectosphere. The composite image in A′ was generated using the customized tile scan function of Zeiss AxioVision software. (B,B′) Anti-SYNAPSIN immunostaining (green) on β1-int RNAi trunk fragment at 10 dpa. Orthogonal view shows three ectospheres in the anterior blastema at different positions (yellow arrowhead in xy view, white arrowhead in yz view, red arrowhead in xz view). White box indicates magnified area shown in B′. DNA (Hoechst) is blue. Scale bars: 150 µm (A); 100 µm (B).

