Fig. 5.
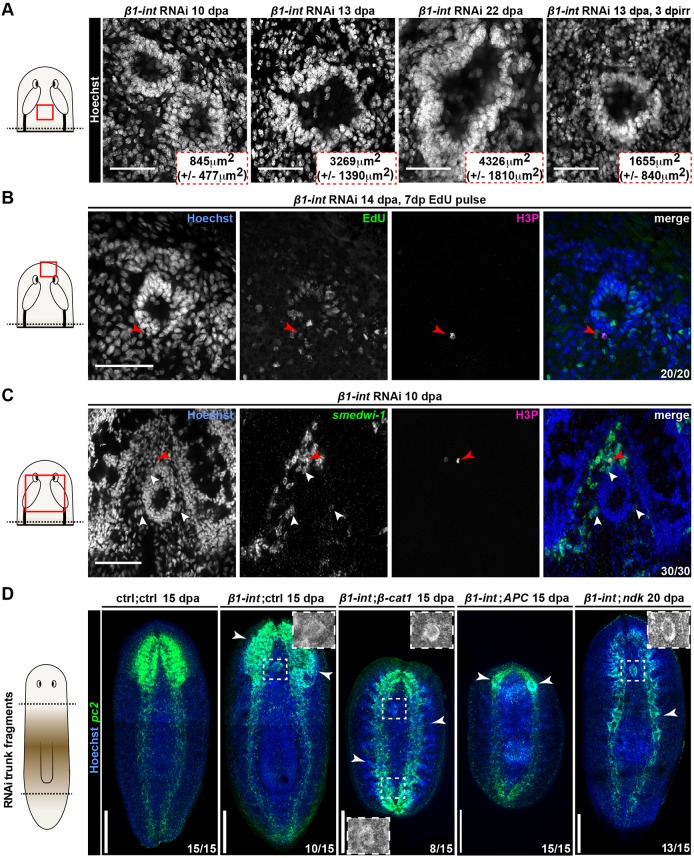
Ectosphere formation depends on neoblasts and anterior cues. (A) Ectospheres visualized by Hoechst staining (gray) in untreated or irradiated (3 dpirr) β1-int RNAi planarians. Average areas with s.d. of at least seven animals per time point are displayed. (B) EdU-pulse chase (green) of sphere-forming cells 7 days post injection (dpinj) and 14 dpa. The red arrowhead points to an anti-H3P+ mitotic cell. (C) FISH against smedwi-1 (green) in combination with immunostaining against H3P (red arrowhead) reveals neoblasts in the periphery of ectospheres (white arrowheads) in anterior regenerating β1-int RNAi fragments 10 dpa. (D) Ectospheres, visualized by FISH against pc2 (green) in regenerating trunk fragments of double RNAi planarians (ctrl;ctrl, β1-int;ctrl, β1-int;β-cat1, β1-int;APC, β1-int;ndk) at 15 or 20 dpa. White boxes highlight ectospheres in Hoechst (gray) channel. White arrowheads point to ectopic neural protrusions, described as brain primordium for APC RNAi animals (Iglesias et al., 2008). Red boxes in schemes illustrate areas of the images in the regeneration blastema of A-C. DNA (Hoechst) is blue. Composite images in D were generated using the customized tile scan function of Zeiss AxioVision software. Scale bars: 100 µm (A-C); 250 µm (D).

