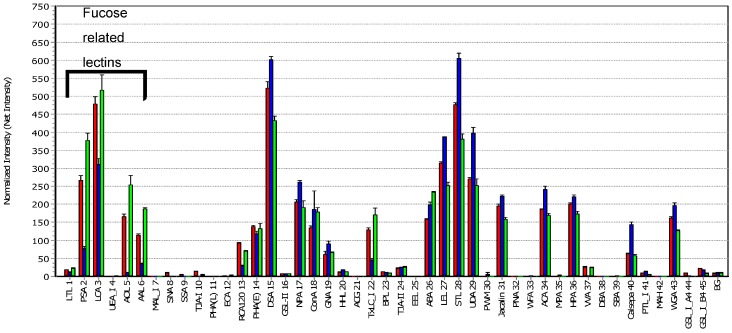
Figure 3.
Lectin Array Analysis. Antibodies were labelled by a Cy3 fluorescent dye. All antibodies were diluted, applied to the lectin microarray and measured at different gains. The results were combined with the gain-merging procedure and further normalized by its intensity. To graph the glyco-profile each antibody signal was set in relation to its normalized (averaged) net intensity. The first six lectins are recognizing fucose. The control antibody is a therapeutic antibody of immunoglobulin G1 (IgG1) isotype and was used to show the profile of another fucosylated immunoglobulin. Legend: MB311■, MB314■, and control IgG1■; BG = Background.

