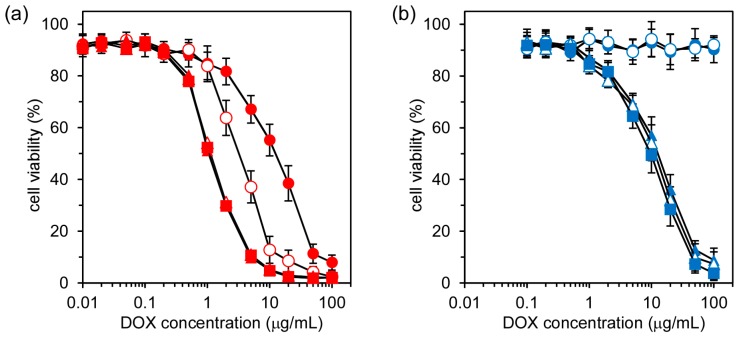
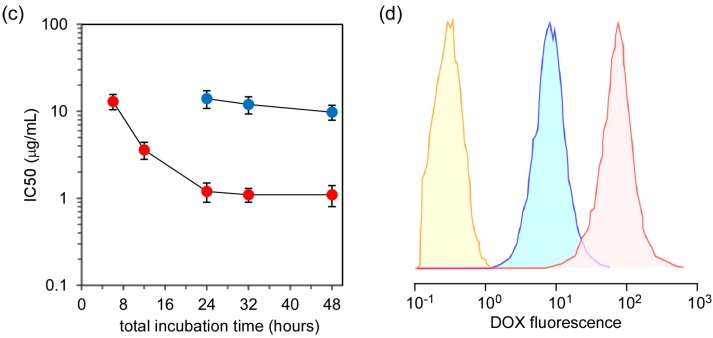
Figure 5.
Anticancer effect of free DOX and DOX in SS-bonded nanocapsules to HeLa cells. The change in cell viabilities with different DOX concentrations and incubation periods for free DOX (a) and DOX in SS-bonded nanocapsules (b); Incubation time dependence of IC50 values for free DOX and DOX in SS-bonded nanocapsules (c); Fluorescence distribution of HeLa cells treated with free DOX and DOX in SS-bonded nanocapsules for 4 h (d). In (a,b), the plots for 6, 12, 24, 32, and 48 h total incubation are represented by closed circles, open circles, closed triangles, open triangles, and closed squares, respectively. The data are the average of three experiments ± SD. In (c), free DOX and DOX in SS-bonded nanocapsules are represented by red and blue plots, respectively. In (d), free DOX, DOX in SS-bonded nanocapsules and control (without treatment) are represented by red, blue, and yellow distributions.


