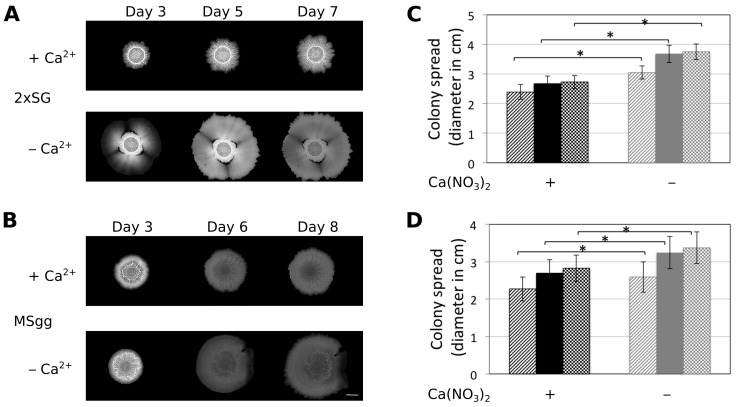
Figure 1.
Presence of Ca2+ restricts colony expansion. Colonies of B. subtilis are shown in the presence and absence of Ca2+ on 2×SG (A) and MSgg (B) media at different days after inoculation. The scale bar at the lower right corner denotes 5 mm. The colony expansion diameters are presented on 2×SG (C) and MSgg (D) media after three or four (striped), five or six (filled), and seven or eight (checked) days, respectively, after inoculation in the presence (black bars) or absence (grey bars of Ca2. The error bars indicate 95% confidence intervals. * denotes significant differences (p < 0.05) analysed with paired t-test.

