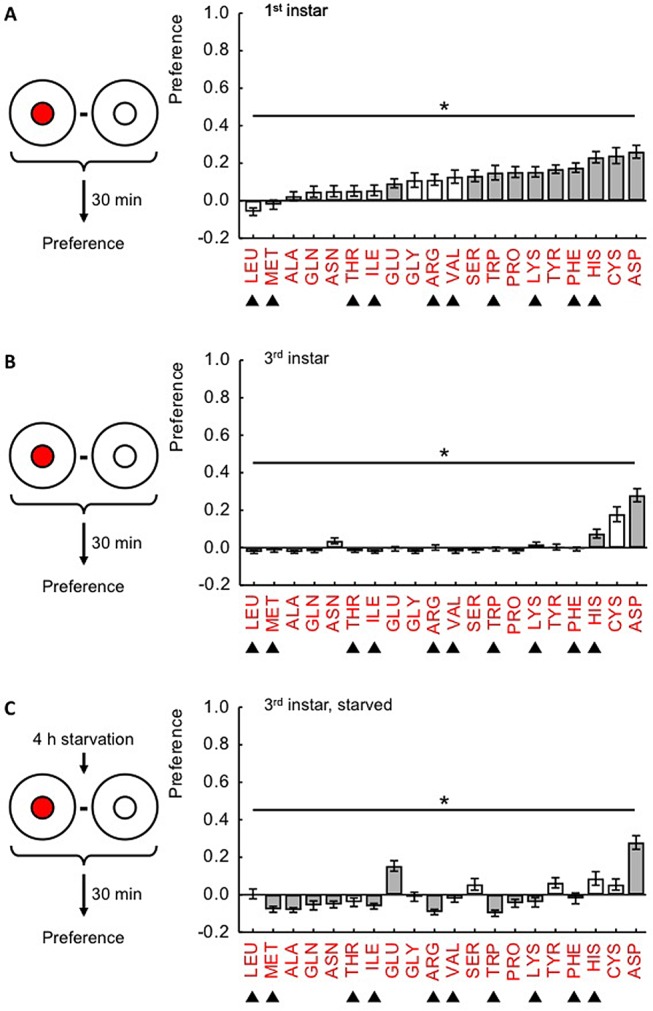
Fig. 1.

Innate preference differs across 20 individual amino acids and depends on stage and starvation. Groups of larvae are placed on a Petri dish that contains in its centre either one of 20 amino acids (small red circle) or plain agar (small white circle), in both cases surrounded by plain agar. After 30 min, the larvae are counted and preferences are calculated. For the underlying ratios of animals in the inner circle versus total, see Fig. S2. (A) Preferences of first-instar larvae differ across amino acids (P<0.05, H=127). From the 20 amino acids tested, GLU, SER, TRP, PRO, LYS, TYR, PHE, HIS, CYS and ASP are significantly preferred as indicated by shading of the bars (P<0.05 in one-sample sign tests, corrected for multiple comparisons according to Bonferroni-Holm). (B) Preferences of third-instar larvae also differ across amino acids (P<0.05, H=167.5). Only HIS and ASP are significantly preferred. LEU, GLY, VAL, SER and PRO are weakly yet significantly avoided. Details as in A. (C) After 4 h of food-deprivation in distilled water, preference scores of third-instar larvae differ across amino acids (P<0.05, H=166.5), with GLU and ASP being significantly preferred. MET, ALA, GLN, ASN, ILE, ARG, TRP, PRO and LYS are significantly avoided at weak to moderate levels. Details as in A. For amino acid abbreviations, see Materials and Methods. Filled triangles indicate amino acids classified as essential by Sang and King (1961). Bars and error bars display mean±s.e.m. Sample sizes for each case respectively are: (A) 33-35, (B) 35, (C) 35.
