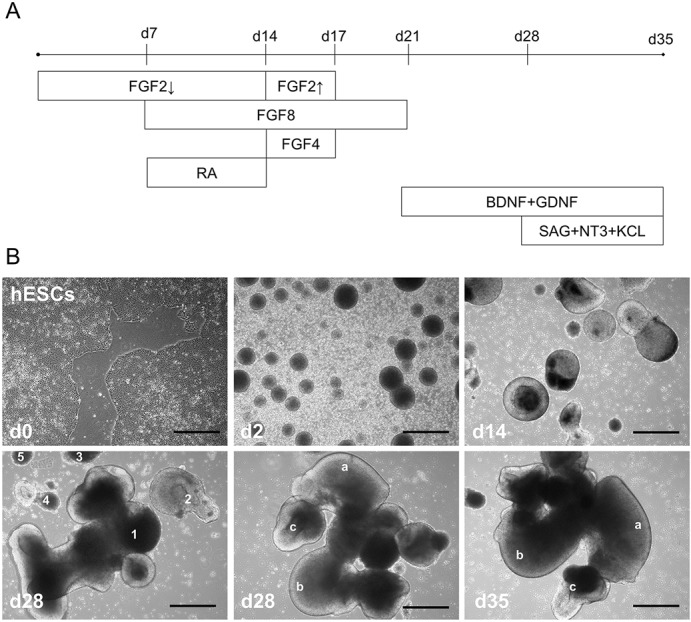
Fig. 1.

Pro-cerebellar signaling molecules induce complex 3D organoid structures. (A) Timeline of protocol indicating what day specific factors were added to culture medium. For FGF2 arrows refer to lower (4 ng ml−1, down arrow) and higher (20 ng ml−1, up arrow) concentrations. (B) Bright-field images show typical examples of cultures at: d0 (as ESC colonies), d2 (EBs), d14 (after induction with RA+FGF8), d28 [after patterning/before maturation, with aggregates (indicated by numbers 1-5) varying in size and complexity], d28 (a large aggregate with complex features identified by letters a-c), d35 (same aggregate from d28 with same features indicated by letters a-c allowing comparison after 7 day maturation step with SAG). Scale bars: 100 μm.
