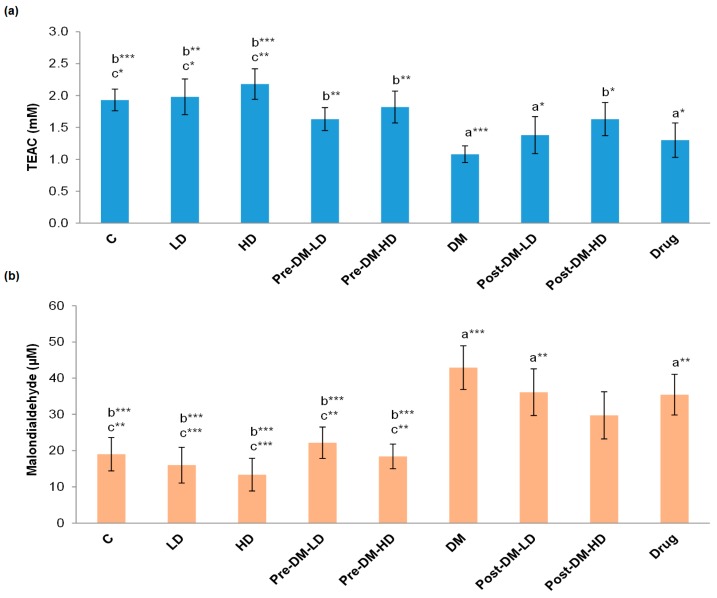
Figure 2.
(a) Effect of GBRE supplement on the total antioxidant capacity of the experimental rats. The values are represented as Trolox equivalent of antioxidant capacity (TEAC); (b) MDA values of different rat groups. The MDA values are indirectly proportional to the lipid peroxidation inhibition ability. All the values are represented as mean ± SD of three determinations. C: Control, LD: Low dose of GBRE to naïve rat, HD: High dose of GBRE to naïve rat, DM: Diabetes Mellitus induced rat, Pre-DM-LD: Low dose of GBRE to naïve rat and induced DM, Pre-DM-HD: High dose of GBRE to naïve rat and induced DM; Post-DM-LD: Low dose of GBRE to DM rat, Post-DM-HD: High dose of GBRE to DM rat. The significant difference between the groups (a = when compared with control group; b = when compared with DM group; c = when compared with the drug group) were represented as * (p < 0.05), ** (p < 0.01), and *** (p < 0.001).

