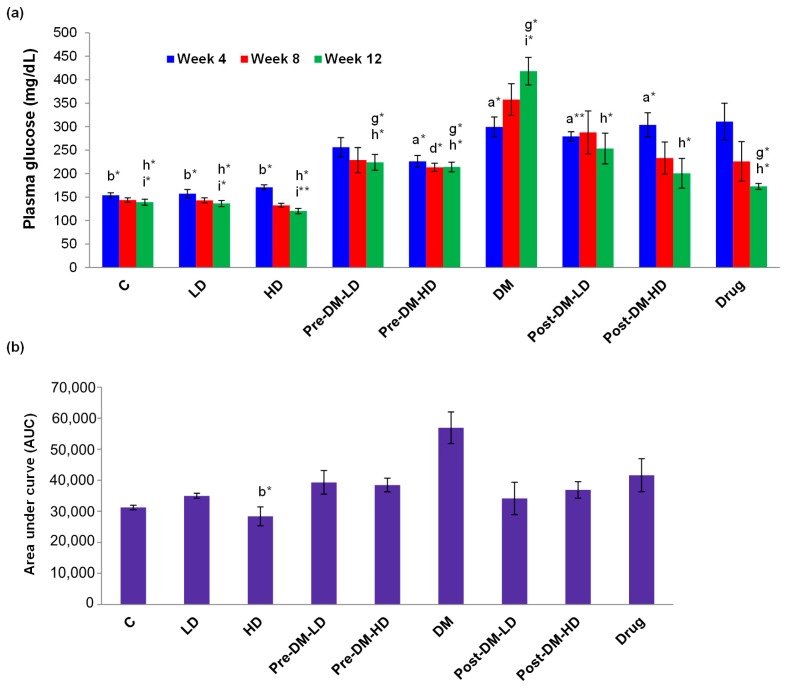
Figure 4.
(a) Effect of GBRE supplement on the plasma glucose profile of rats during the experimental period. The plasma glucose level of the experimental rats was measured weekly (4, 8, and 12); (b) Effect of GBRE supplement on the glucose tolerance of experimental rats. The area under the curve (AUC) for glucose concentrations obtained from the oral glucose tolerance test were calculated using the trapezoidal rule [26]. C: Control, LD: Low dose of GBRE to naïve rat, HD: High dose of GBRE to naïve rat, DM: Diabetes Mellitus induced rat, Pre-DM-LD: Low dose of GBRE to naïve rat and induced DM, Pre-DM-HD: High dose of GBRE to naïve rat and induced DM; Post-DM-LD: Low dose of GBRE to DM rat, Post-DM-HD: High dose of GBRE to DM rat. The significant difference between the groups (a,d,g = when compared with control group; b,e,h = when compared with DM group; c,f,i = when compared with the drug group) were represented as * (p < 0.05), and ** (p < 0.01).

