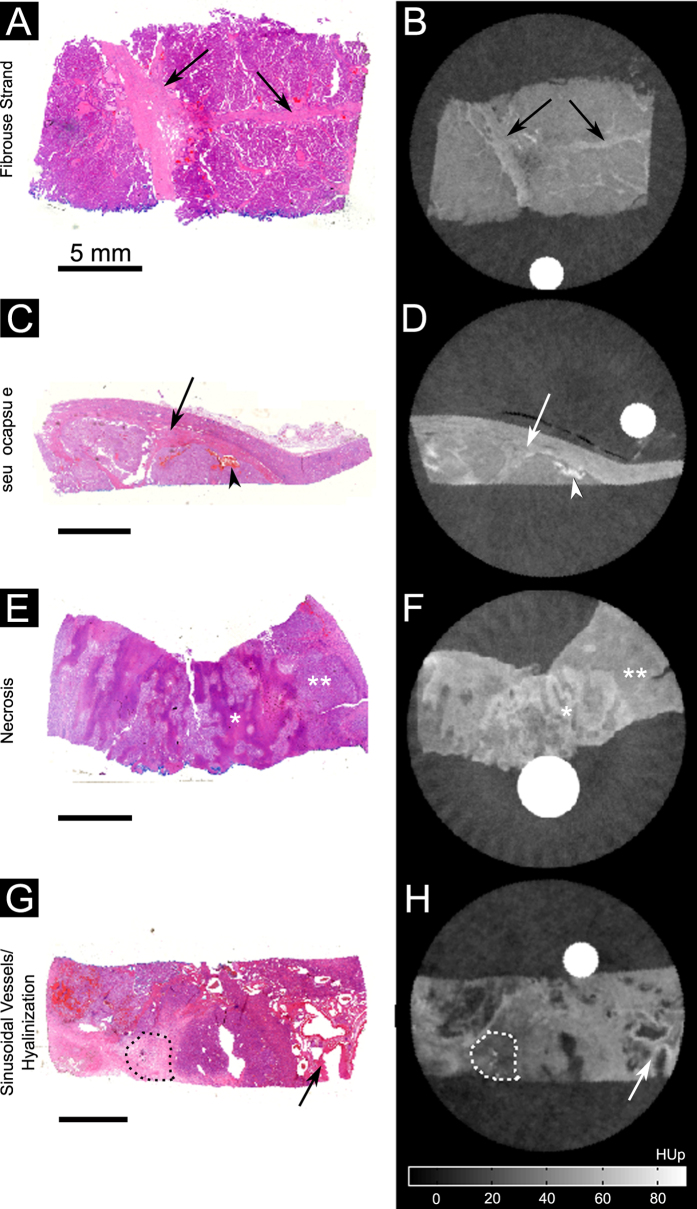
Figure 5. Visual comparison between histological slices and grating-based PC-CT images.
Histological slices (HE-staining) (A,C,E,G) showed a good visual agreement with phase-contrast images (B,D,F,H) for visualization of different tumor tissue components (arrows) like fibrous strands (A,B), pseudocapsule (arrow) and hemorrhage (arrowhead) (C,D), diffuse necrotic areas with higher signal (*) and tumor tissue with lower phase-contrast signal (**) (E,F) as well as sinusoidal-vessels (arrow) and hyalinization (dotted line) (G,H).

