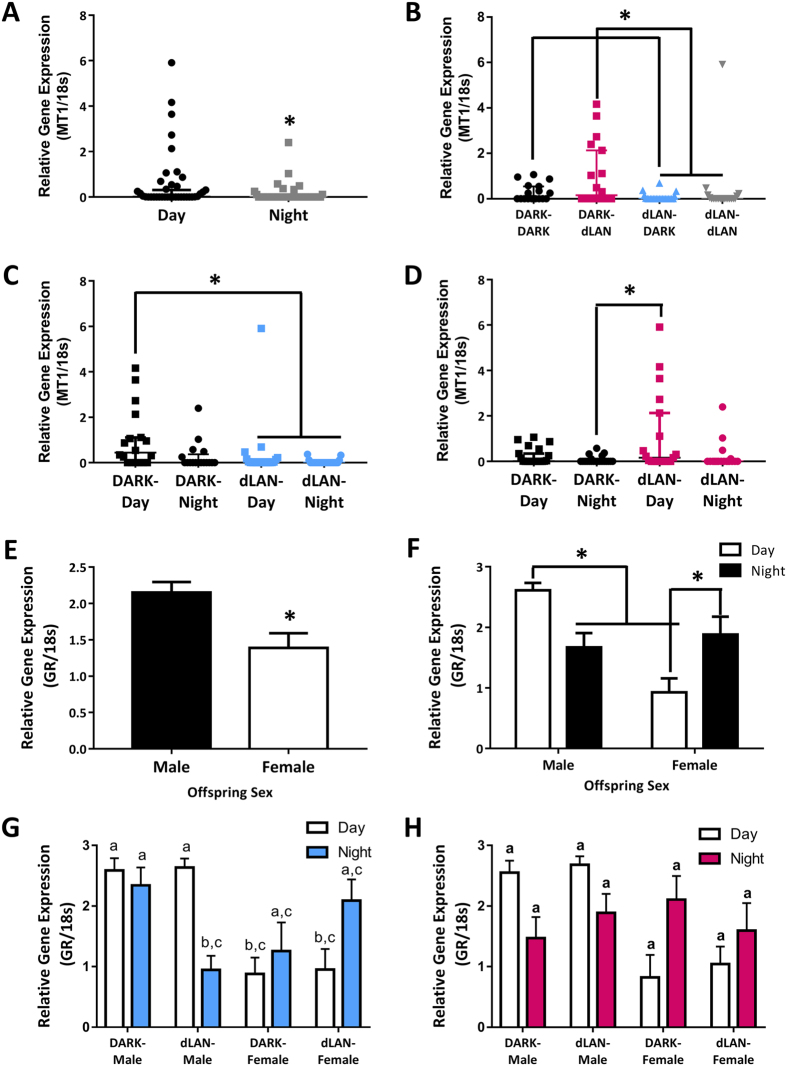
Figure 4. Paternal exposure to dLAN alters splenic MT1 and GR expression.
Splenic MT1 expression by time of day (A), parental (B), paternal (C), and maternal lighting condition (D). Splenic GR expression by offspring sex (E), offspring sex by time of day (F), offspring sex by time of day by paternal lighting (G), offspring sex by time of day by maternal lighting (H). Parametric data presented as mean ± SEM. Non-parametric data are presented as median with 95% confidence interval. n = 4–14 per group per sex. *p < 0.05. Different letters indicate significant differences between groups.

