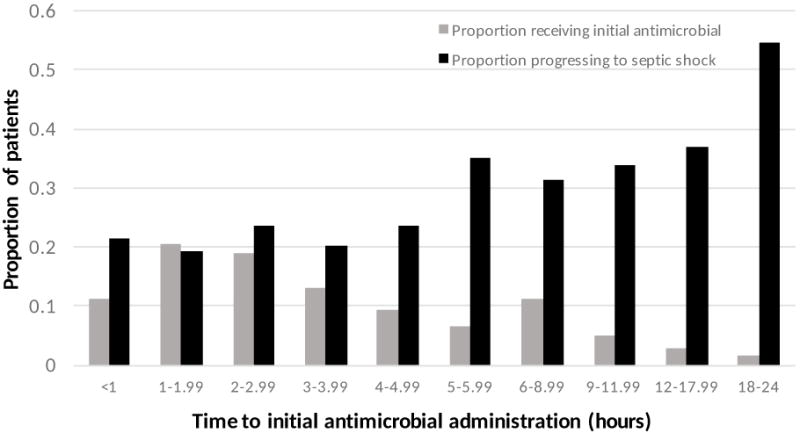
Figure 2.

Antimicrobial administration timing and proportion of patients progressing to shock. The gray bars represent the proportion of the total cohort who received their initial antimicrobial during the given time interval. The black bars represent the proportion of patients receiving their initial antimicrobial in the given time interval who progressed to septic shock.
