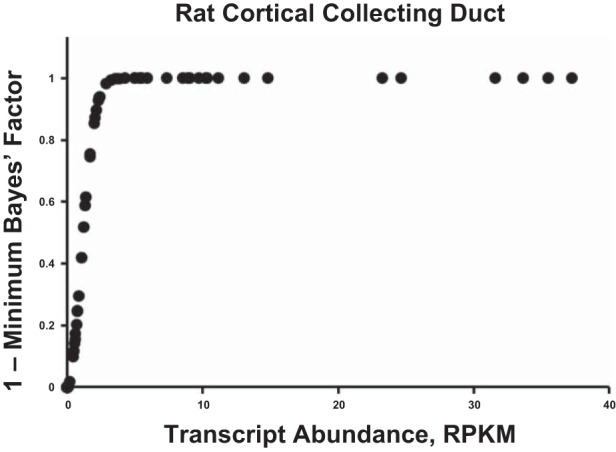
Fig. 5.

Example of the conversion of experimental data to likelihood values using the complements of minimum Bayes’ factors. The data are mRNA abundance levels measured as RPKM obtained using RNA-Seq in microdissected cortical collecting ducts from rats. The conversion uses the equation: 1 – exp(– [Z*]2/2), for each DUB where Z* is the ratio of each value to the intrinsic noise in the measurement (Table 1).
