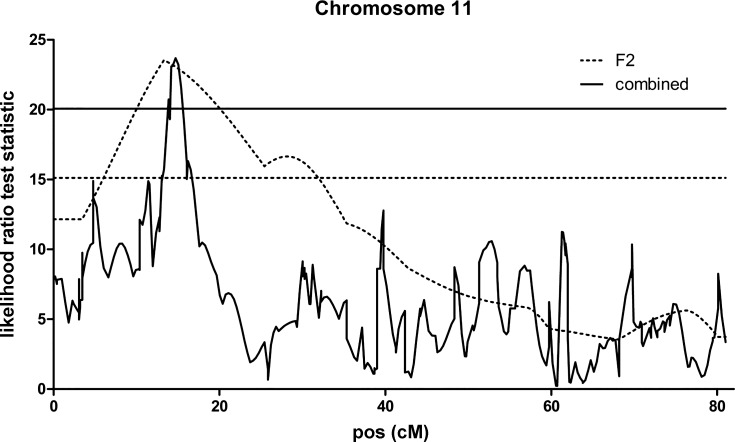
Fig. 3.
Type I fiber cross-sectional area quantitative trait loci (QTL) on chromosome 11. Analyses were carried out in the F2 intercross and in the combined F2 and F34 populations. x-Axis indicates the relative position in the linkage map in centimorgan (cM). The thresholds are at the level of 0.05 genome wise significance for the F2 output (dotted line) and combined output (solid line).

