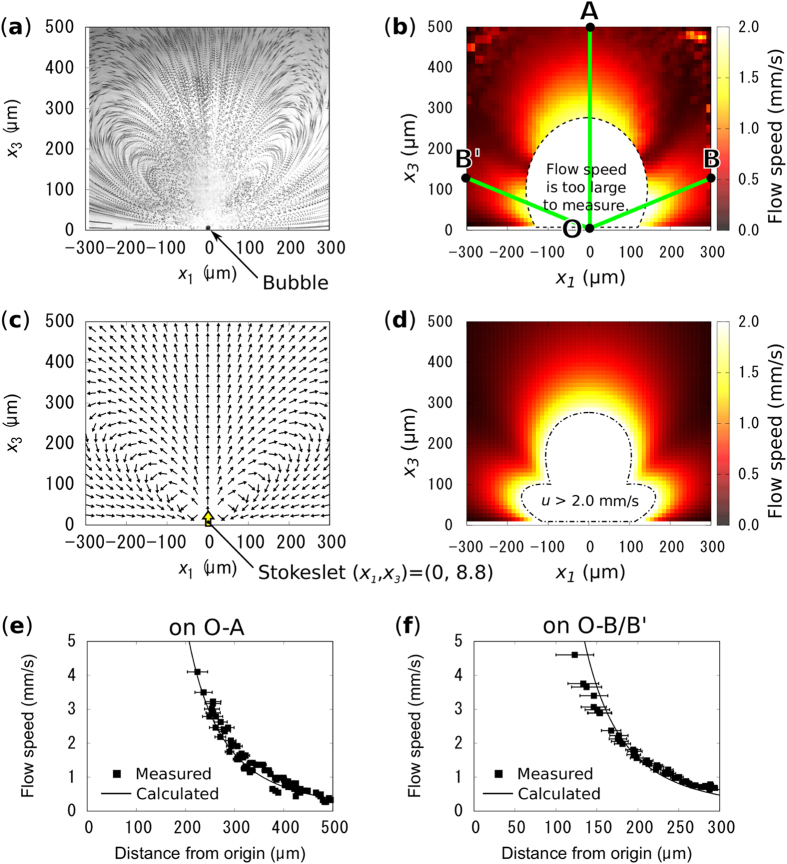
Figure 4.
(a) The trajectory of the PS spheres in the Marangoni flow around the vapor bubble, which shows the flow directions distribution. (b) Measured flow speed distribution in the region corresponding to (a). (c,d) show calculated flow vector and speed distribution around a stokeslet placed above the surface of the GNF, respectively. The measurements and calculations show excellent agreement. (e,f) show manually measured flow speed (black square) on lines O-A and O-B/B’, that are indicated in (b), respectively. The sold black lines collespond to the calculation results shown in (d).

