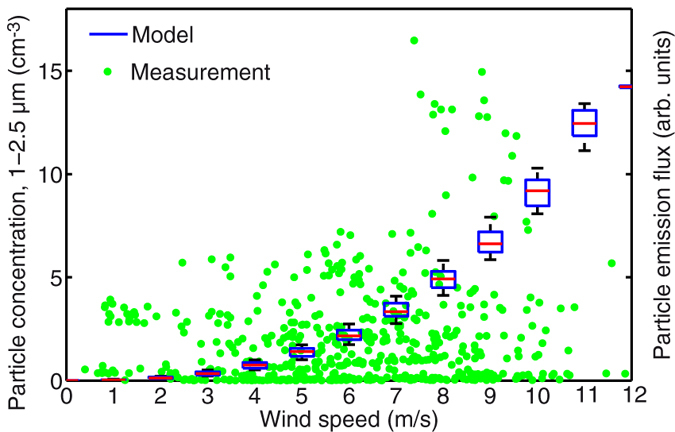
Figure 2. Influence of wind on particle abundance.

Hourly-averaged particle concentration in the 1–2.5 μm size range. Data are compared with the empirical wind cap model of Gong et al.31 applied to the real wind measurements. The boxplots depict the magnitude of the fluctuations induced by the consideration of the Jaegle temperature correction8 (See text for details).
