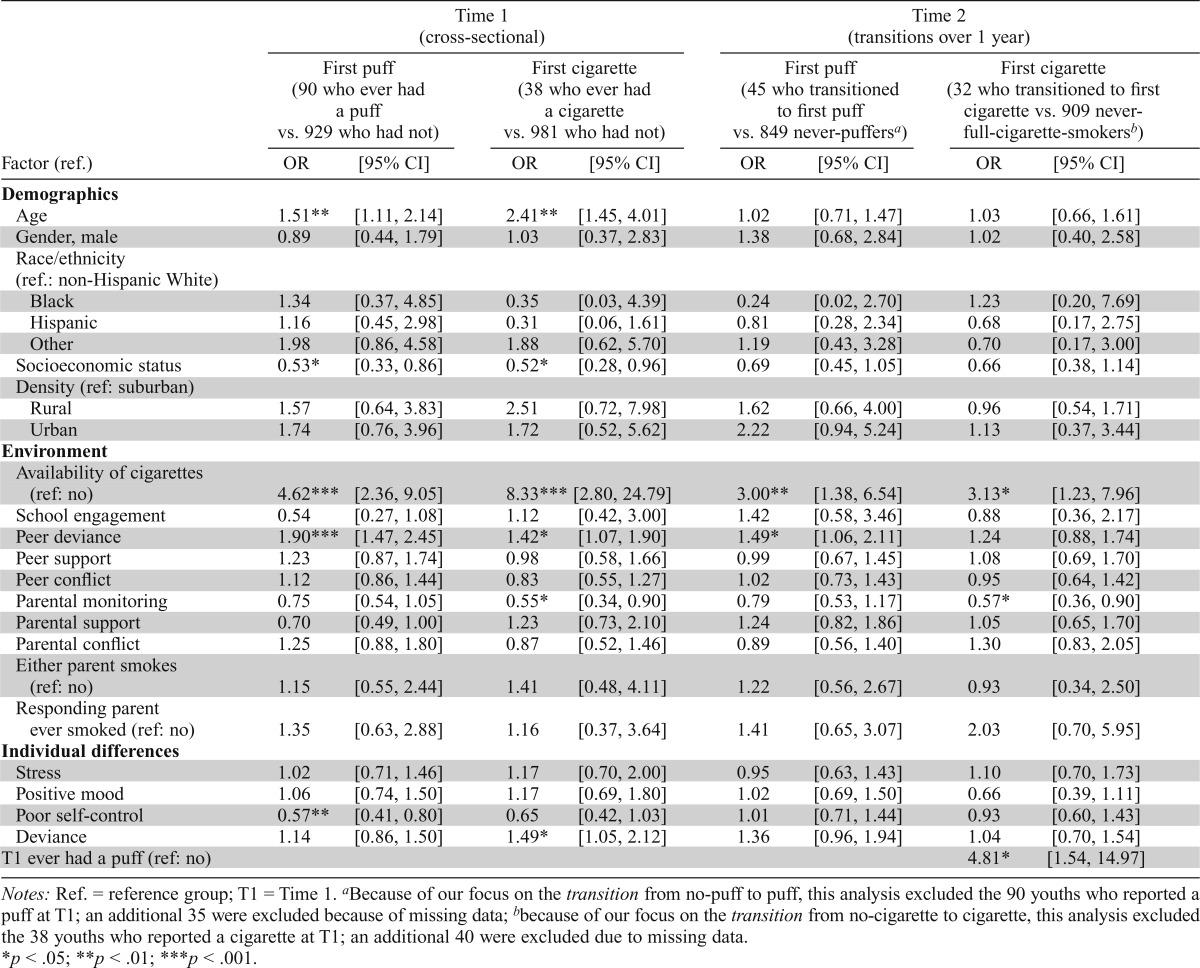
Table 3.
Odds ratios at the final step of the four multivariable logistic regressions
| Time 1 (cross-sectional) |
Time 2 (transitions over 1 year) |
|||||||
| First puff (90 who ever had a puff vs. 929 who had not) |
First cigarette (38 who ever had a cigarette vs. 981 who had not) |
First puff (45 who transitioned to first puff vs. 849 never-puffersa) |
First cigarette (32 who transitioned to first cigarette vs. 909 never-full-cigarette-smokersb) |
|||||
| Factor (ref.) | OR | [95% CI] | OR | [95% CI] | OR | [95% CI] | OR | [95% CI] |
| Demographics | ||||||||
| Age | 1.51** | [1.11, 2.14] | 2.41** | [1.45, 4.01] | 1.02 | [0.71, 1.47] | 1.03 | [0.66, 1.61] |
| Gender, male | 0.89 | [0.44, 1.79] | 1.03 | [0.37, 2.83] | 1.38 | [0.68, 2.84] | 1.02 | [0.40, 2.58] |
| Race/ethnicity (ref.: non-Hispanic White) | ||||||||
| Black | 1.34 | [0.37, 4.85] | 0.35 | [0.03, 4.39] | 0.24 | [0.02, 2.70] | 1.23 | [0.20, 7.69] |
| Hispanic | 1.16 | [0.45, 2.98] | 0.31 | [0.06, 1.61] | 0.81 | [0.28, 2.34] | 0.68 | [0.17, 2.75] |
| Other | 1.98 | [0.86, 4.58] | 1.88 | [0.62, 5.70] | 1.19 | [0.43, 3.28] | 0.70 | [0.17, 3.00] |
| Socioeconomic status | 0.53* | [0.33, 0 .86] | 0.52* | [0.28, 0.96] | 0.69 | [0.45, 1.05] | 0.66 | [0.38, 1.14] |
| Density (ref: suburban) | ||||||||
| Rural | 1.57 | [0.64, 3.83] | 2.51 | [0.72, 7.98] | 1.62 | [0.66, 4.00] | 0.96 | [0.54, 1.71] |
| Urban | 1.74 | [0.76, 3.96] | 1.72 | [0.52, 5.62] | 2.22 | [0.94, 5.24] | 1.13 | [0.37, 3.44] |
| Environment | ||||||||
| Availability of cigarettes (ref: no) | 4.62*** | [2.36, 9.05] | 8.33*** | [2.80, 24.79] | 3.00** | [1.38, 6.54] | 3.13* | [1.23, 7.96] |
| School engagement | 0.54 | [0.27, 1.08] | 1.12 | [0.42, 3.00] | 1.42 | [0.58, 3.46] | 0.88 | [0.36, 2.17] |
| Peer deviance | 1.90*** | [1.47, 2.45] | 1.42* | [1.07, 1.90] | 1.49* | [1.06, 2.11] | 1.24 | [0.88, 1.74] |
| Peer support | 1.23 | [0.87, 1.74] | 0.98 | [0.58, 1.66] | 0.99 | [0.67, 1.45] | 1.08 | [0.69, 1.70] |
| Peer conflict | 1.12 | [0.86, 1.44] | 0.83 | [0.55, 1.27] | 1.02 | [0.73, 1.43] | 0.95 | [0.64, 1.42] |
| Parental monitoring | 0.75 | [0.54, 1.05] | 0.55* | [0.34, 0.90] | 0.79 | [0.53, 1.17] | 0.57* | [0.36, 0.90] |
| Parental support | 0.70 | [0.49, 1.00] | 1.23 | [0.73, 2.10] | 1.24 | [0.82, 1.86] | 1.05 | [0.65, 1.70] |
| Parental conflict | 1.25 | [0.88, 1.80] | 0.87 | [0.52, 1.46] | 0.89 | [0.56, 1.40] | 1.30 | [0.83, 2.05] |
| Either parent smokes (ref: no) | 1.15 | [0.55, 2.44] | 1.41 | [0.48, 4.11] | 1.22 | [0.56, 2.67] | 0.93 | [0.34, 2.50] |
| Responding parent ever smoked (ref: no) | 1.35 | [0.63, 2.88] | 1.16 | [0.37, 3.64] | 1.41 | [0.65, 3.07] | 2.03 | [0.70, 5.95] |
| Individual differences | ||||||||
| Stress | 1.02 | [0.71, 1.46] | 1.17 | [0.70, 2.00] | 0.95 | [0.63, 1.43] | 1.10 | [0.70, 1.73] |
| Positive mood | 1.06 | [0.74, 1.50] | 1.17 | [0.69, 1.80] | 1.02 | [0.69, 1.50] | 0.66 | [0.39, 1.11] |
| Poor self-control | 0.57** | [0.41, 0.80] | 0.65 | [0.42, 1.03] | 1.01 | [0.71, 1.44] | 0.93 | [0.60, 1.43] |
| Deviance | 1.14 | [0.86, 1.50] | 1.49* | [1.05, 2.12] | 1.36 | [0.96, 1.94] | 1.04 | [0.70, 1.54] |
| T1 ever had a puff (ref: no) | 4.81* | [1.54, 14.97] | ||||||
Notes: Ref. = reference group; T1 = Time 1.
Because of our focus on the transition from no-puff to puff, this analysis excluded the 90 youths who reported a puff at T1; an additional 35 were excluded because of missing data;
because of our focus on the transition from no-cigarette to cigarette, this analysis excluded the 38 youths who reported a cigarette at T1; an additional 40 were excluded due to missing data.
p < .05;
p <.01;
p < .001.

