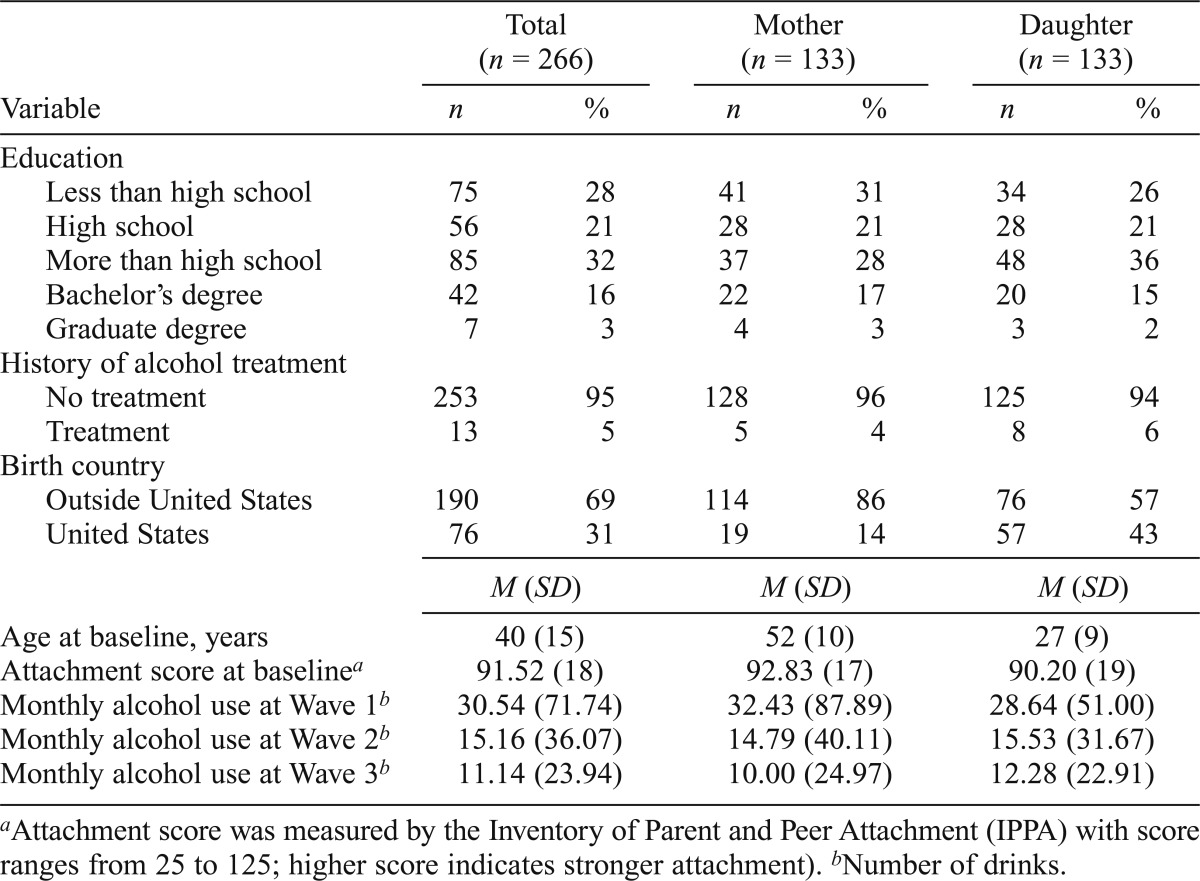
Table 1.
Descriptive analysis of the whole sample and mother and daughter subsamples
| Total (n = 266) |
Mother (n = 133) |
Daughter (n = 133) |
||||
| Variable | n | % | n | % | n | % |
| Education | ||||||
| Less than high school | 75 | 28 | 41 | 31 | 34 | 26 |
| High school | 56 | 21 | 28 | 21 | 28 | 21 |
| More than high school | 85 | 32 | 37 | 28 | 48 | 36 |
| Bachelor’s degree | 42 | 16 | 22 | 17 | 20 | 15 |
| Graduate degree | 7 | 3 | 4 | 3 | 3 | 2 |
| History of alcohol treatment | ||||||
| No treatment | 253 | 95 | 128 | 96 | 125 | 94 |
| Treatment | 13 | 5 | 5 | 4 | 8 | 6 |
| Birth country | ||||||
| Outside United States | 190 | 69 | 114 | 86 | 76 | 57 |
| United States | 76 | 31 | 19 | 14 | 57 | 43 |
| M (SD) | M (SD) | M (SD) | ||||
| Age at baseline, years | 40 (15) | 52 (10) | 27 (9) | |||
| Attachment score at baselinea | 91.52 (18) | 92.83 (17) | 90.20 (19) | |||
| Monthly alcohol use at Wave 1b | 30.54 (71.74) | 32.43 (87.89) | 28.64 (51.00) | |||
| Monthly alcohol use at Wave 2b | 15.16 (36.07) | 14.79 (40.11) | 15.53 (31.67) | |||
| Monthly alcohol use at Wave 3b | 11.14 (23.94) | 10.00 (24.97) | 12.28 (22.91) | |||
Attachment score was measured by the Inventory of Parent and Peer Attachment (IPPA) with score ranges from 25 to 125; higher score indicates stronger attachment).
Number of drinks.

