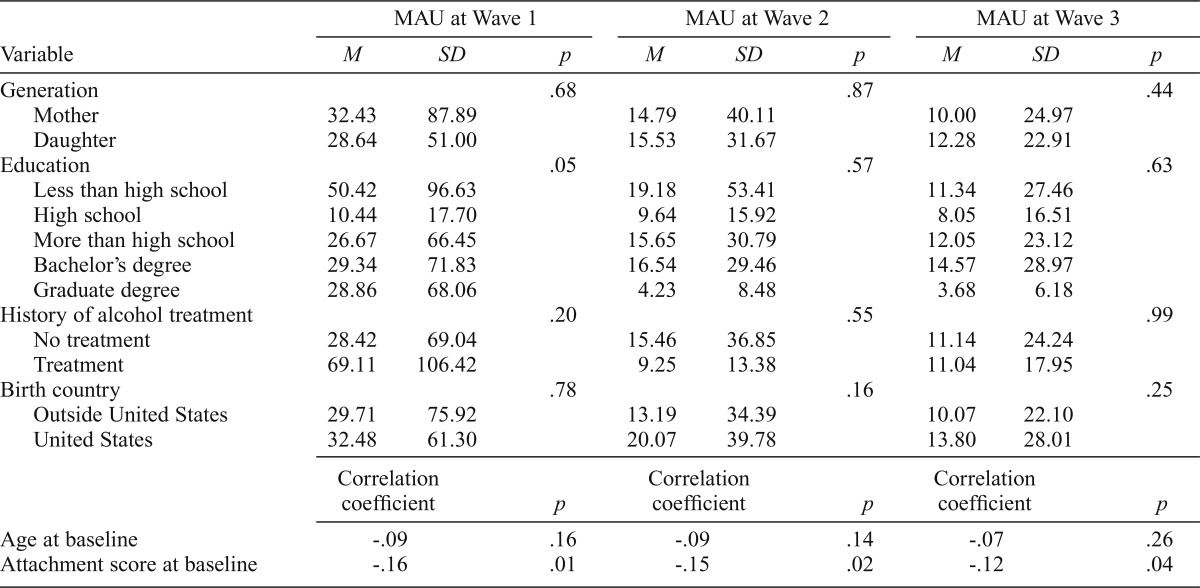
Table 2.
Descriptive analysis on the relationship between covariates and monthly alcohol use (MAU) over time
| MAU at Wave 1 |
MAU at Wave 2 |
MAU at Wave 3 |
|||||||
| Variable | M | SD | p | M | SD | p | M | SD | p |
| Generation | .68 | .87 | .44 | ||||||
| Mother | 32.43 | 87.89 | 14.79 | 40.11 | 10.00 | 24.97 | |||
| Daughter | 28.64 | 51.00 | 15.53 | 31.67 | 12.28 | 22.91 | |||
| Education | .05 | .57 | .63 | ||||||
| Less than high school | 50.42 | 96.63 | 19.18 | 53.41 | 11.34 | 27.46 | |||
| High school | 10.44 | 17.70 | 9.64 | 15.92 | 8.05 | 16.51 | |||
| More than high school | 26.67 | 66.45 | 15.65 | 30.79 | 12.05 | 23.12 | |||
| Bachelor’s degree | 29.34 | 71.83 | 16.54 | 29.46 | 14.57 | 28.97 | |||
| Graduate degree | 28.86 | 68.06 | 4.23 | 8.48 | 3.68 | 6.18 | |||
| History of alcohol treatment | .20 | .55 | .99 | ||||||
| No treatment | 28.42 | 69.04 | 15.46 | 36.85 | 11.14 | 24.24 | |||
| Treatment | 69.11 | 106.42 | 9.25 | 13.38 | 11.04 | 17.95 | |||
| Birth country | .78 | .16 | .25 | ||||||
| Outside United States | 29.71 | 75.92 | 13.19 | 34.39 | 10.07 | 22.10 | |||
| United States | 32.48 | 61.30 | 20.07 | 39.78 | 13.80 | 28.01 | |||
| Correlation coefficient | p | Correlation coefficient | p | Correlation coefficient | p | ||||
| Age at baseline | -.09 | .16 | -.09 | .14 | -.07 | .26 | |||
| Attachment score at baseline | -.16 | .01 | -.15 | .02 | -.12 | .04 | |||

