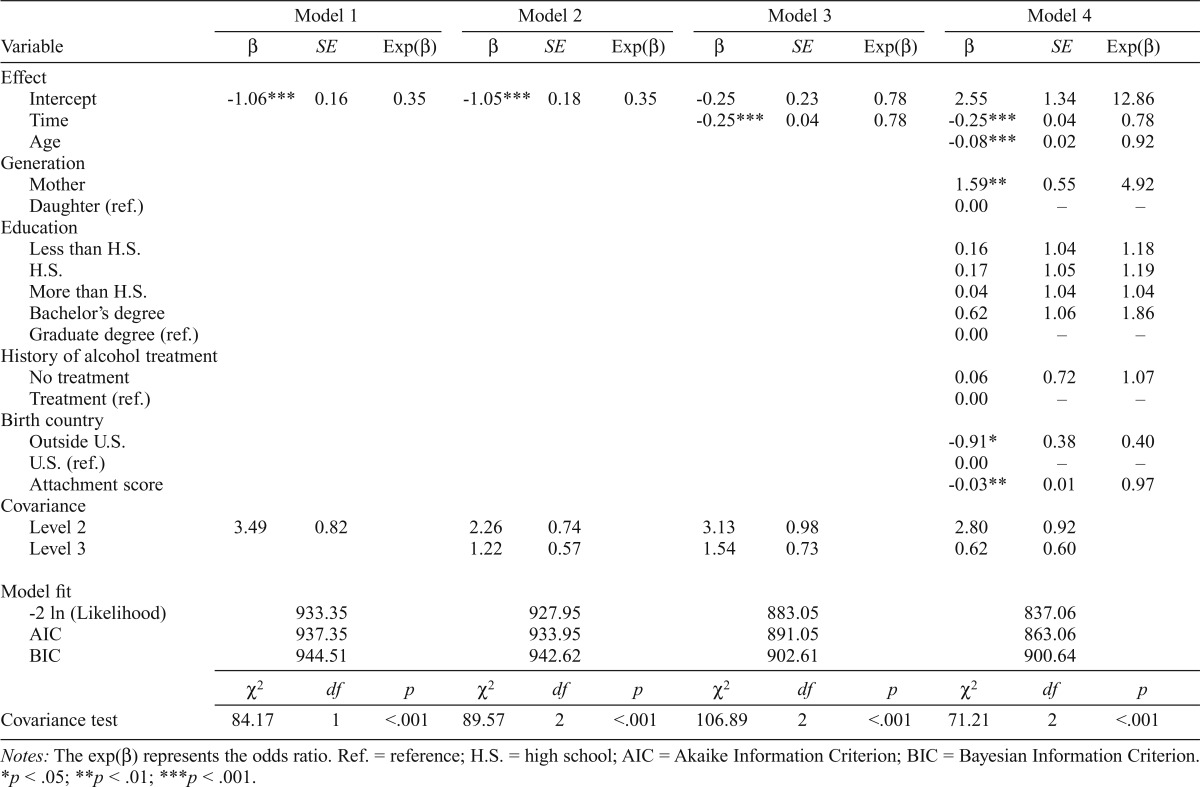
Table 4.
Multilevel longitudinal modeling of longitudinal data on heavy alcohol or drug use over time
| Model 1 |
Model 2 |
Model 3 |
Model 4 |
|||||||||
| Variable | β | SE | Exp(β) | β | SE | Exp(β) | β | SE | Exp(β) | β | SE | Exp(β) |
| Effect | ||||||||||||
| Intercept | -1.06*** | 0.16 | 0.35 | -1.05*** | 0.18 | 0.35 | -0.25 | 0.23 | 0.78 | 2.55 | 1.34 | 12.86 |
| Time | -0.25*** | 0.04 | 0.78 | -0.25*** | 0.04 | 0.78 | ||||||
| Age | -0.08*** | 0.02 | 0.92 | |||||||||
| Generation | ||||||||||||
| Mother | 1.59** | 0.55 | 4.92 | |||||||||
| Daughter (ref.) | 0.00 | – | – | |||||||||
| Education | ||||||||||||
| Less than H.S. | 0.16 | 1.04 | 1.18 | |||||||||
| H.S. | 0.17 | 1.05 | 1.19 | |||||||||
| More than H.S. | 0.04 | 1.04 | 1.04 | |||||||||
| Bachelor’s degree | 0.62 | 1.06 | 1.86 | |||||||||
| Graduate degree (ref.) | 0.00 | – | – | |||||||||
| History of alcohol treatment | ||||||||||||
| No treatment | 0.06 | 0.72 | 1.07 | |||||||||
| Treatment (ref.) | 0.00 | – | – | |||||||||
| Birth country | ||||||||||||
| Outside U.S. | -0.91* | 0.38 | 0.40 | |||||||||
| U.S. (ref.) | 0.00 | – | – | |||||||||
| Attachment score | -0.03** | 0.01 | 0.97 | |||||||||
| Covariance | ||||||||||||
| Level 2 | 3.49 | 0.82 | 2.26 | 0.74 | 3.13 | 0.98 | 2.80 | 0.92 | ||||
| Level 3 | 1.22 | 0.57 | 1.54 | 0.73 | 0.62 | 0.60 | ||||||
| Model fit | ||||||||||||
| -2 ln (Likelihood) | 933.35 | 927.95 | 883.05 | 837.06 | ||||||||
| AIC | 937.35 | 933.95 | 891.05 | 863.06 | ||||||||
| BIC | 944.51 | 942.62 | 902.61 | 900.64 | ||||||||
| χ2 | df | p | χ2 | df | p | χ2 | df | p | χ2 | df | p | |
| Covariance test | 84.17 | 1 | <.001 | 89.57 | 2 | <.001 | 106.89 | 2 | <.001 | 71.21 | 2 | <.001 |
Notes: The exp(β) represents the odds ratio. Ref. = reference; H.S. = high school; AIC = Akaike Information Criterion; BIC = Bayesian Information Criterion.
p < .05;
p < .01;
p < .001.

