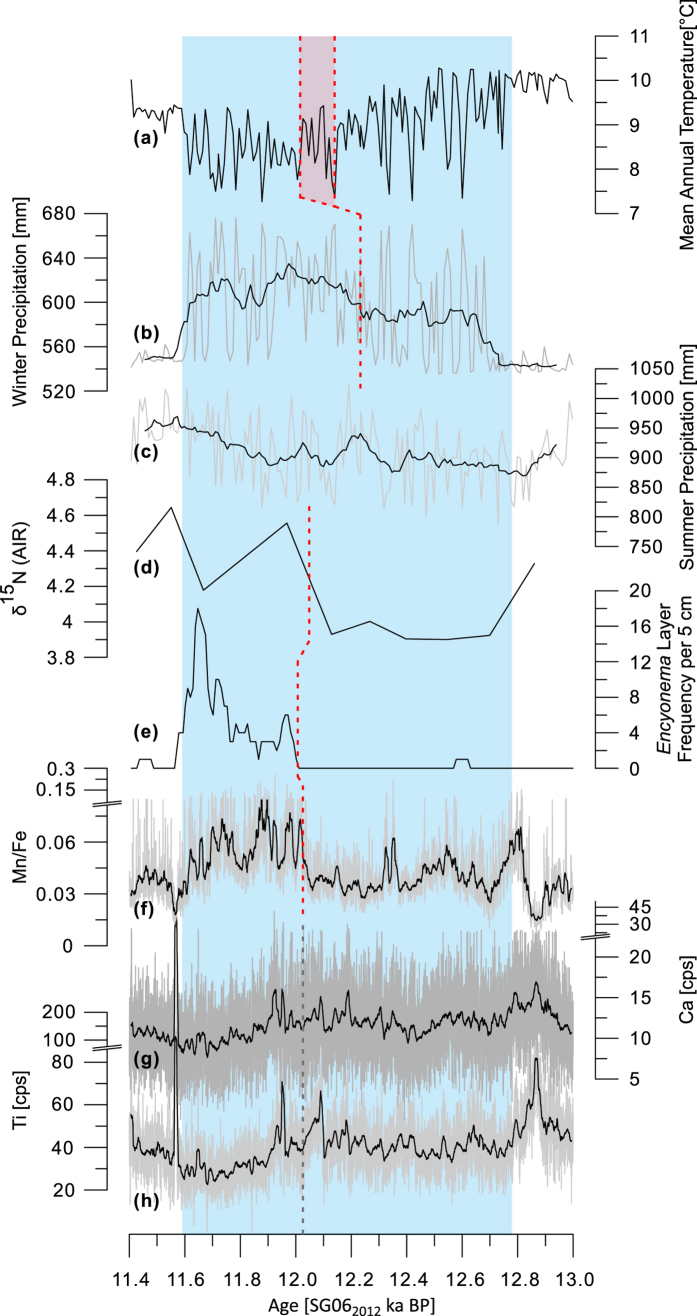
Figure 2. Summary of results from the multi-proxy analysis of the YDS interval of core SG06.
In (b,c), and (f) to (h) grey curves are original data; black lines are the moving average ((b,c) 11 pt, (f) to (h) 201 pt); red dashed line marks the point of bi-partition in the respective proxies (see supplement for further details); in (g) and (i) the trend-signal is overprinted by event layers around the bi-partition, therefore, the point of change is uncertain and a grey dashed line (extrapolated from the Mn/Fe ratio) is used; note that the μXRF curve of K is not shown since it is strongly correlated with Ti (R = 0.74; Fig. S3); light blue background marks the YDS.

