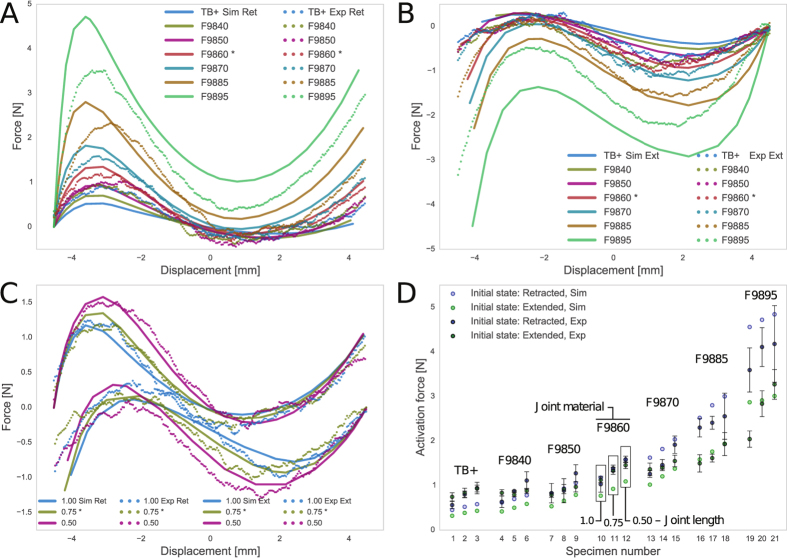
Figure 4. Simulation and experimental force-displacement graphs.
(A,B) Includes specimens with fixed joint length but varying material. This shows that 1) an increase in joint stiffness increases the activation force, 2) simulation shows agreement with experimental data, and 3) the extended initial configuration attains lower activation force than the retracted initial configuration. (C) Includes specimens with fixed joint material stiffness but varying joint length and shows that a decrease in joint length increases the activation force. (D) Shows the critical force attained by each specimen (see SI. Table 3 to identify the specimens). *Denotes the benchmark configuration.

