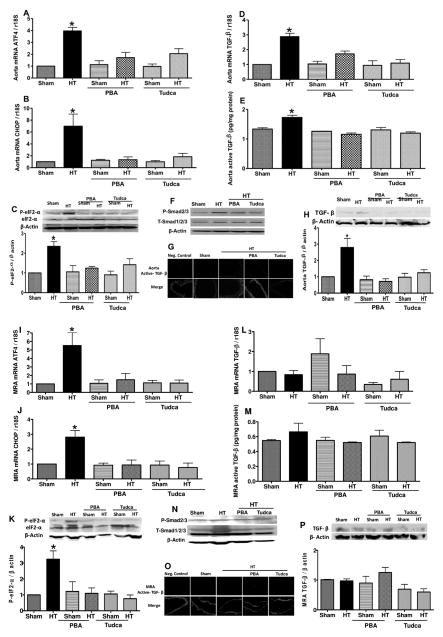
Figure 3.
A, B, I, and J, Activating transcription factor 4 (ATF4) and C/EBP homologous protein (CHOP) mRNA levels, normalized to 18S ribosomal RNA (rRNA), in aorta and mesenteric resistance arteries (MRA) in all groups of mice, n=6. C and K, Western blot analysis and quantitative data for eukaryotic translation initiation factor 2α (eIF2α), P-eIF2α in aorta and MRA in all groups of mice, n=5. D and L, Transforming growth factor-β1 (TGF-β1) mRNA levels, normalized to 18S rRNA, in aorta and MRA in all groups of mice, n=6. E, M, G, and O, Active TGF-β1 levels in aorta and MRA in all groups of mice, n=4. F, H, N, and P, Western blot analysis and quantitative data for TGF-β1, T-Smad1/2/3, and P-Smad2/3 in aorta and MRA in all groups, n=5.*P<0.05 for HT vs control, control+PBA, control+Tudca, HT+PBA, and HT+Tudca. HT indicates hypertension; PBA, 4-phenylbutyric acid; Tudca, taurine-conjugated ursodeoxycholic acid.

