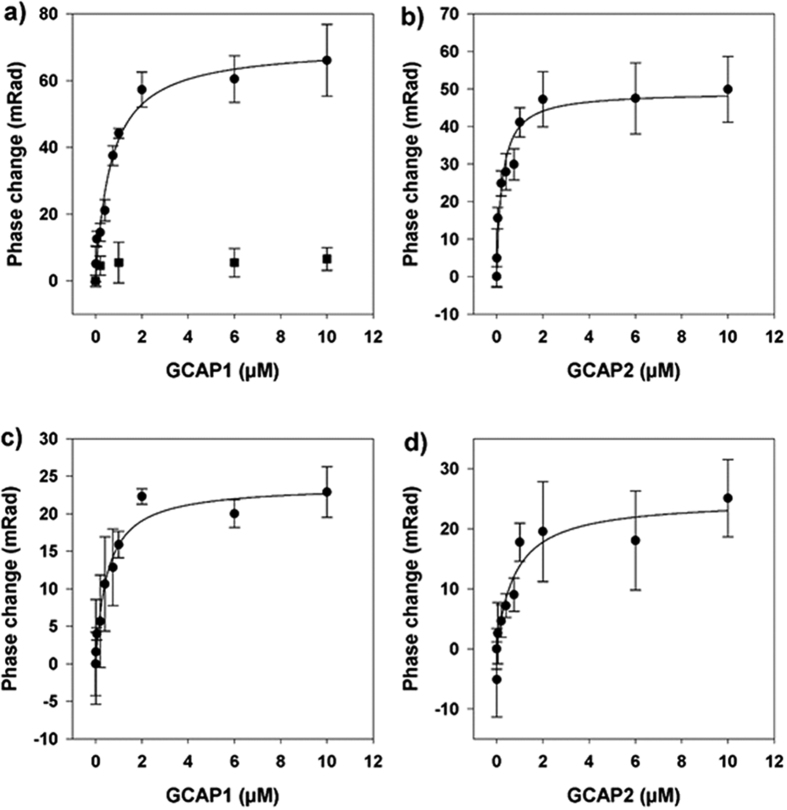
Figure 2. Interaction of GCAP1 and GCAP2 with the full-length human GC-E determined by BSI.
In the top panel 1 mM EGTA was present, in the lower panel saturating 200 μM Ca2+ was present. The following KD values were extracted from a fitting to a simple one ligand binding model: (a) GCAP1 in the presence of EGTA KD = 663 nM ± 121 nM (b) GCAP2 in the presence of EGTA KD = 231 nM ± 63 nM (c) GCAP1 in the presence of Ca2+ KD = 505 nM ± 108 nM (d) GCAP2 in the presence of Ca2+ KD = 418 nM ± 135 nM. Each data point is the average of 4 replications. The control titration displayed in (a) (■) of another EF-hand Ca2+-binding protein, calmodulin (CaM-S17C) resulted in a minor phase shift, showing that the interaction between human GC-E and the GCAPs is a specific binding event. Concentration of calmodulin was 0, 0.75 μM, 6 μM and 10 μM.

