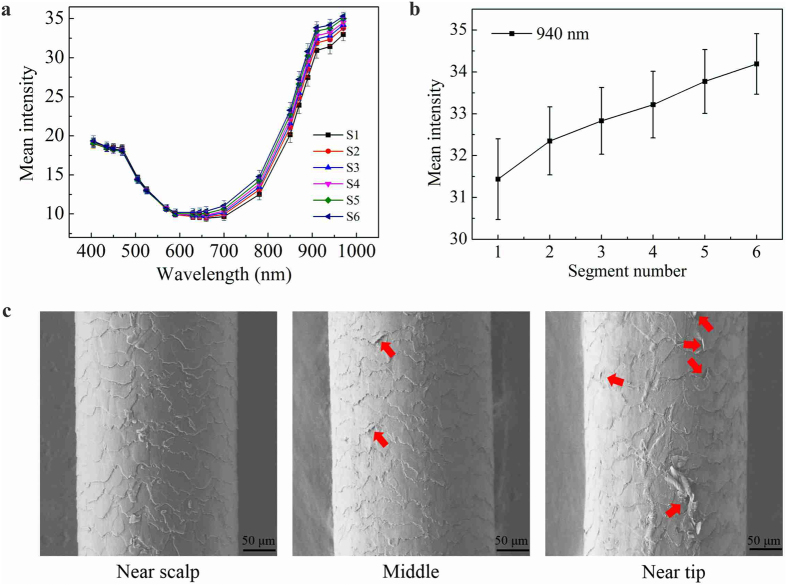
Figure 2. Mean intensity and SEM of different segments in the same sample.
Figure 2a is the average reflection spectra of the six successive segments of the hair, Fig. 2b is the change of average reflection spectra at a single wavelength of 940 nm, and Fig. 2c is the SEM images of hair from different region: near scalp, middle and near tip.

