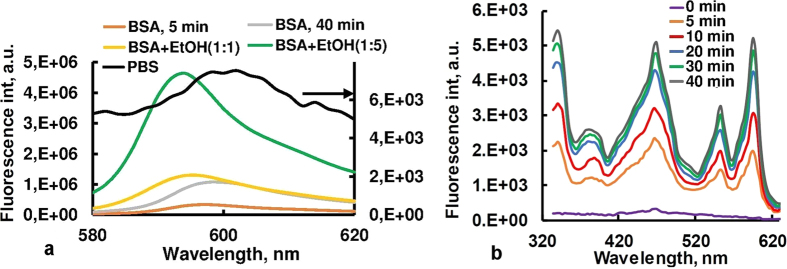
Figure 6.
(a) Fluorescence spectra of the Hyp + CZ composite in PBS before (black line) and after treatment with bovine serum albumin (BSA) and ethanol (EtOH), λexc = 545 nm. Volume ratios of Hyp-BSA complex to ethanol are 1:1 (yellow line) and 1: 5 (green line). (b) Time-dependant recovery of excitation spectrum of Hyp in presence of BSA, λem = 650 nm.

