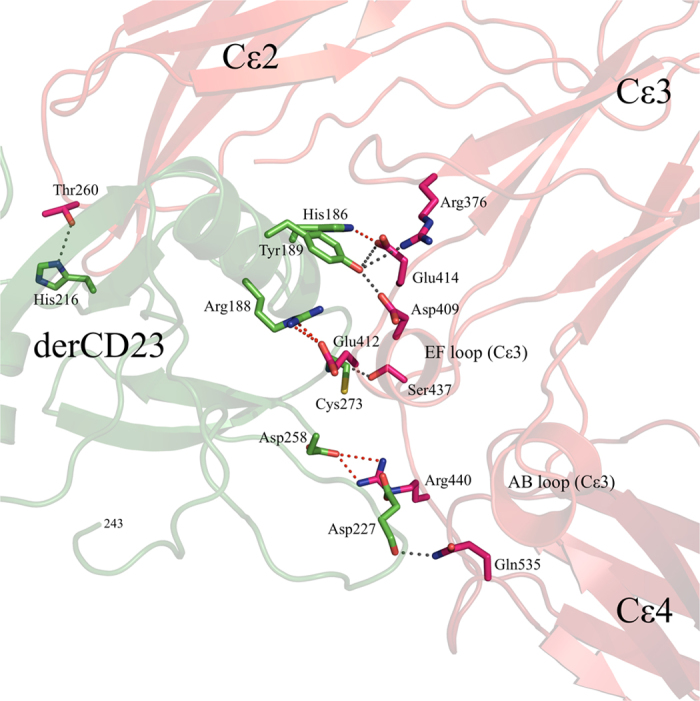
Figure 2. Salt bridges and hydrogen bonds at the derCD23/IgE-Fc interface.

The five H-bonds associated with salt bridges in both independent complexes are shown in red, and the six remaining H-bonds are shown in black.

The five H-bonds associated with salt bridges in both independent complexes are shown in red, and the six remaining H-bonds are shown in black.