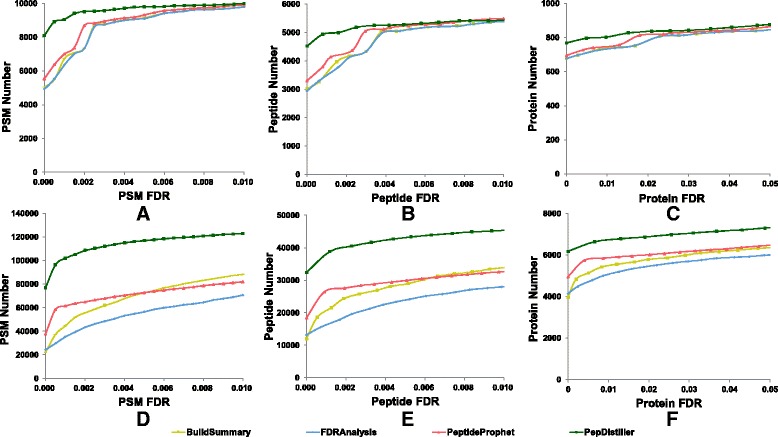
Fig. 4.

Plot figures of the numbers of PSM, peptide and protein filtered by four quality control methods under the estimated FDRs on Pfu dataset (a-c) and LM3 dataset (d-f)

Plot figures of the numbers of PSM, peptide and protein filtered by four quality control methods under the estimated FDRs on Pfu dataset (a-c) and LM3 dataset (d-f)