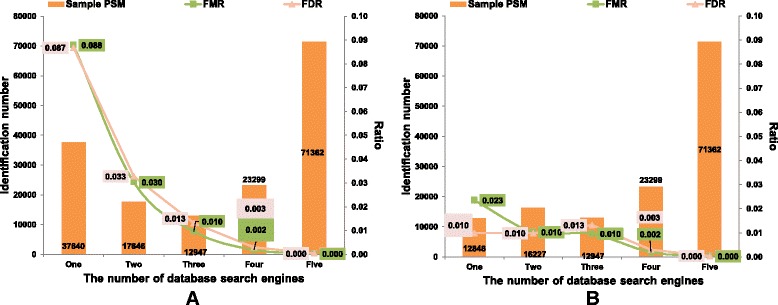
Fig. 6.

Distribution figures of the PSMs, FDRs and FMRs identified by different number of search engines on LM3 dataset. a Distributions of original FDRs and FMRs under 0.01 spectrum FDR. b Distributions of refined FDRs and FMRs under 0.01 spectrum FDR, as the PSMs in each subgroup are further filtered to keep their sub-FDRs lower than the pre-defined one
