
Fig. 3.
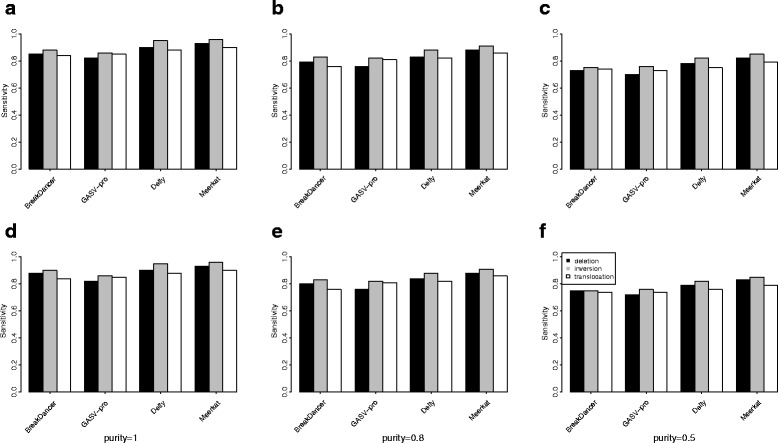
The sensitivity of the four SV detection algorithms with different parameters. Deletions (black), inversion (grey) and translocations (white) are compared, individually. a, b, and c are the simulated data with GC-bias, and d, e, f are the simulated data without GC-bias. The purities are 1 (a, d), 0.8 (b, e) and 0.5 (c, f)