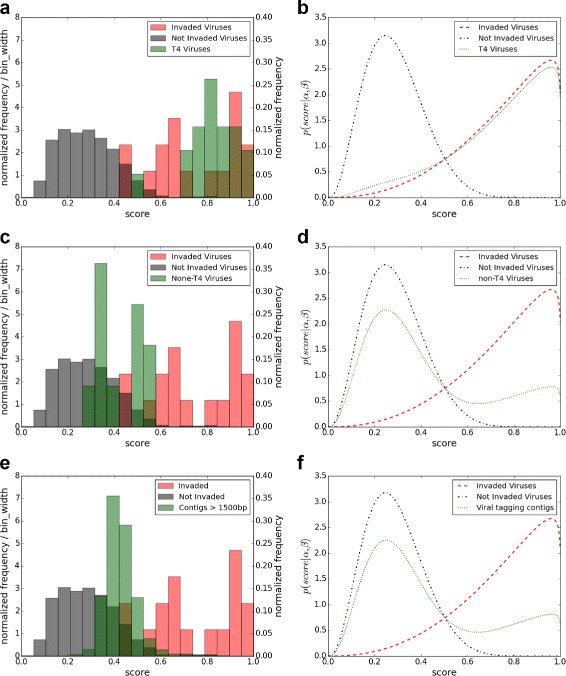
Fig. 3.

The histograms of the RF scores for the viral sequences in the negative and positive data sets, and a T4-like, c non-T4-like, and e viral contigs, respectively. The corresponding fitted density functions are given as b, d, and f, respectively. In all of the 6 subfigures, the horizontal axis is the prediction scores. In a, c and e, the right y-axis indicates the fraction and the left y-axis indicates the fraction divided by the bin-size
