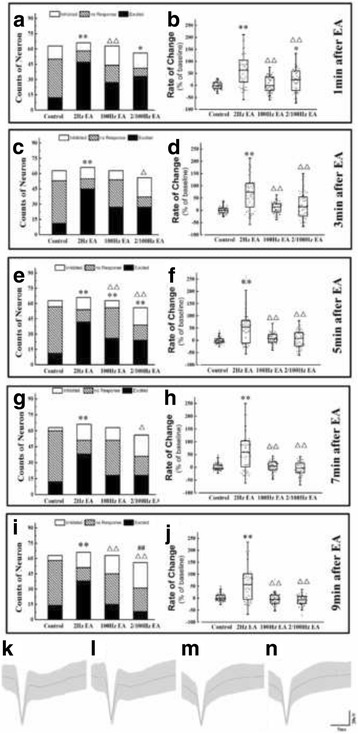
Fig. 1.

The distribution of three types of neurons and the rate of change for the spike frequency in NTS after EA stimulated at ST 36. The population of three types of neurons of NTS in four groups at 1 min (a), 3 min (c), 5 min (e), 7 min (g) and 9 min (i) after EA stimulated at ST36. And the rate of change of spike frequency for NTS neurons in four groups at 1 min (b), 3 min (d), 5 min (f), 7 min (h) and 9 min (j) after EA stimulated at ST36. Results of the number of the three types of neurons are real numbers and the rates of change of spike frequency are mean, quartile and standard deviation. n = 5. *P < 0.05, **P < 0.01 versus control group, △P < 0.05, △△P < 0.01 versus model group, ##P < 0.01 versus EA group. Examples show the original traces in the NTS before and after 2 Hz EA (K, M), and examples show original traces in the NTS before and after 100 Hz EA (L, N). The original traces was extracted from 2 to 4 min after recording
