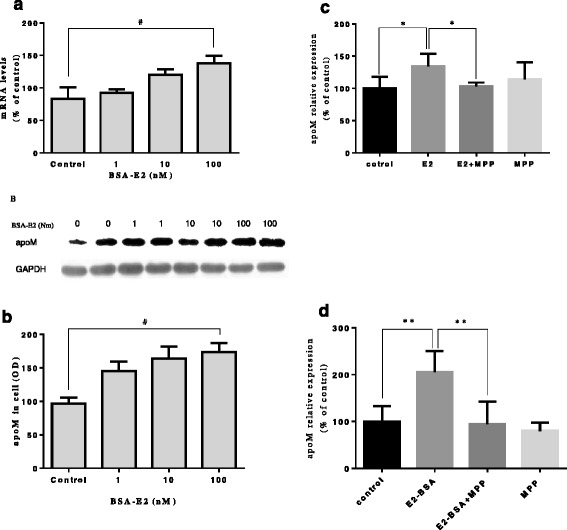
Fig. 1.

Effects of estrogens and MPP on the apoM levels of in HepG2 cells. HepG2 cells were cultured with E2-BSA (1 ~ 100 nM) for 24 h (a and b). HepG2 cells were cultured with E2 (10 μM) or E2-BSA (100 nM) together MPP (1 μM) for 24 h (c and d). The mRNA and protein levels of apoM were determined as described in the materials and methods. Data are means ± SE. The control groups are represented as 100%. # P < 0.05 vs control; * P < 0.05 vs E2;** P < 0.01 vs. E2 + BSA
