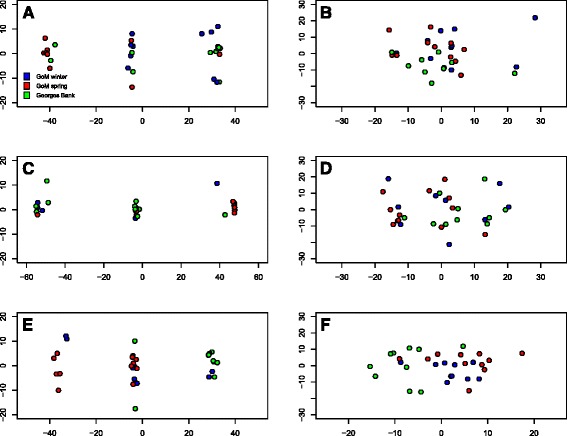
Fig. 4.

Principal component analyses. PCA was performed on exonic SNPs from LG02 (top row), LG07 (middle row), and LG12 (bottom row). SNPs within the LD block on that LG are shown on the left, SNPs outside the LD block on the right. In all cases, as expected, SNPs within each LD block separate into three distinct vertical clusters along PC axis 1, indicating the three genotypes that individuals might possess for each LD block. This separation is lost, however, for PCA on SNPs outside the LD block, but in the same linkage group. Note that SNPs outside of the LD block on LG07 (D, above) may signify the presence of another, undiscovered linkage disequilibrium cluster, as the pattern appears diffusely similar to that in C
