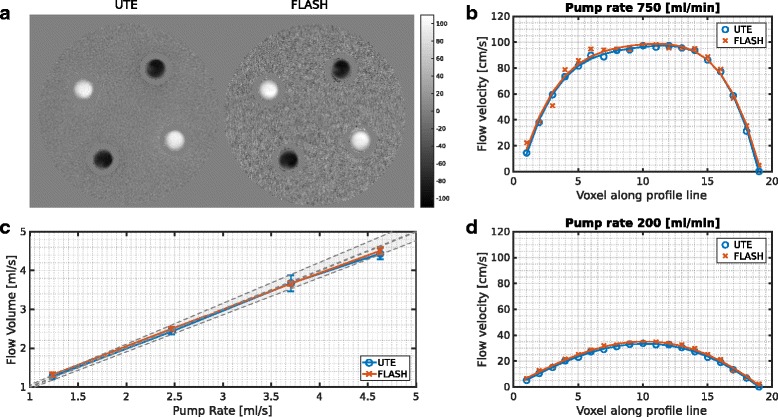
Fig. 2.

Axial view of the central slice through the flow phantom acquired with the 4D PC UTE and the Cartesian PC FLASH sequence (a), corresponding flow profiles of one tube for a pump rate of 750 ml/min (b) and 200 ml/min (d) as well as the flow volume averaged over all tubes for different pump rates (c). In (c) the gray line represents the pump rate the pump was set to and the corresponding error region for the approximate accuracy that can be expected from the used pump. The axial flow velocity maps shown in (a) were masked based on the magnitude image to exclude noise contributions outside of the phantom and in the border areas of the glass phantom
