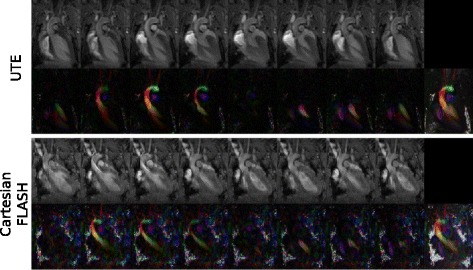
Fig. 5.

Anatomic magnitude images and color-coded flow velocity images of a coronal single slice through the left ventricle for the 4D PC UTE and the Cartesian FLASH reference sequence. Shown from left to right are 8 frames of the cardiac cycle. The flow velocity image in the ninth column is the maximum intensity projection over all frames. For illustration the flow velocity maps are color encoded and are scaled between the velocities of 0 and 120 cm/s, showing the absolute blood velocity for flow from top to bottom in red, from left to right in green, and for through-plane flow in blue. Note that due to the long measurement duration the images of the two sequences were obtained from different measurement sessions and mice
