Fig. 1.

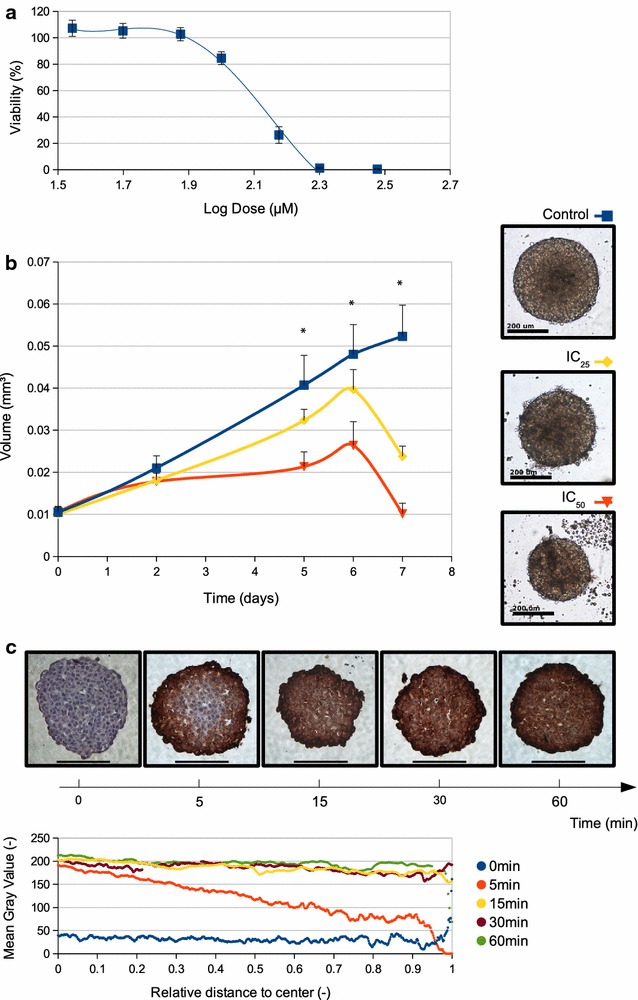
Anti-proliferative effect of CIGB-300 on 2D and 3D cultures. a IC50 determination for H125 monolayer cultures. Each value represents the mean ± SD of three independent experiments. b The IC50 dose obtained in H125 cells growing in monolayer was tested on multicelullar tumor spheroids. Each value represents the mean ± SD of three independent experiments. *p < 0.001 vs. H125 spheroids without treatment, 2-way ANOVA test (left side). Representative images for three different experiments were taken after 5 days of treatment, scale bar 100 μM (right side). c Internalization studies on H125 spheroids were performed treating cells from 5 to 60 min with a biotin-labeled CIGB-300 and visualized by immunocytochemistry. Representative images of three different experiments. Zoom 400×, scale bar 100 μm (top). Immunoreactive staining was quantified as a function of the distance to the spheroid center for each condition (bottom)
