Fig. 2.

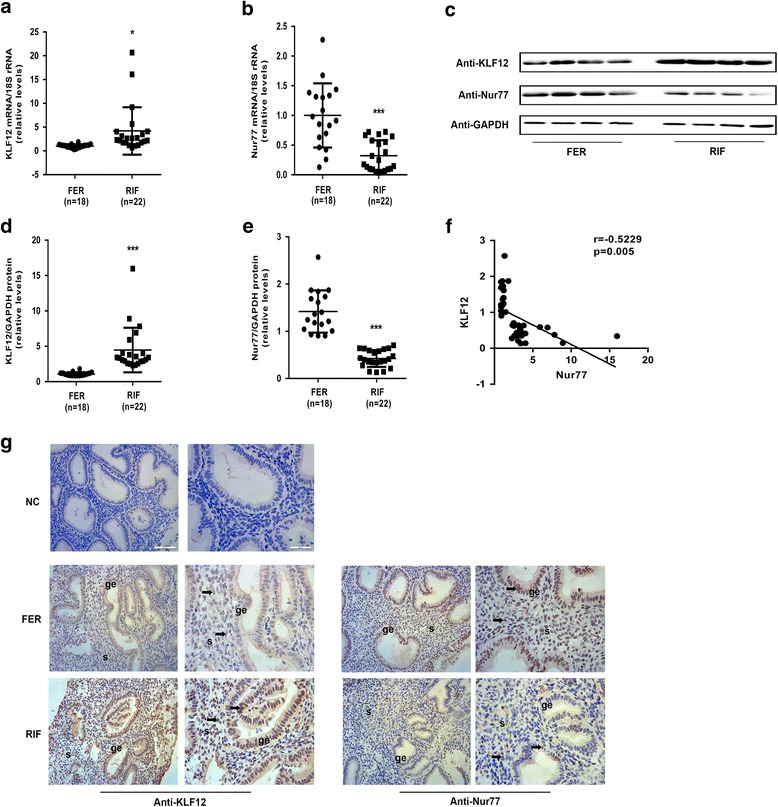
Aberrant expression of KLF12 and Nur77 in the endometrium of patients with RIF. a and b The KLF12 and Nur77 transcript levels in the endometrium of fertile (n = 18) and RIF (n = 22) patients were quantified by real-time PCR and were then normalized to control 18S gene expression. The data are presented relative to the fertile control group (expression was set to 1). * P < 0.05 and *** P < 0.001 compared with the fertile group, Student’s t-test. c Differences in protein expression in endometrial samples were assessed by Western blotting using antibodies specific to KLF12 and Nur77. d and e The total KLF12 and Nur77 protein levels were normalized to GAPDH expression, and the data for all of the endometrial samples are shown in the scatter plots. *** P < 0.001 compared with the fertile group, Student’s t-test. f Correlation between KLF12 and Nur77 protein expression (n = 40, r = −0.5229, P = 0.005, Pearson correlation analysis). g Immunohistochemical analysis was performed using KLF12 and Nur77 antibodies. Endometrial tissue samples from fertile women and RIF patients are shown at 200× (left panel) and 400× (right panel) magnification. The negative control (NC) is nonspecific rabbit serum. Brown represents positive staining (arrows). Scale bars, 100 μm (left panel) and 50 μm (right panel)
