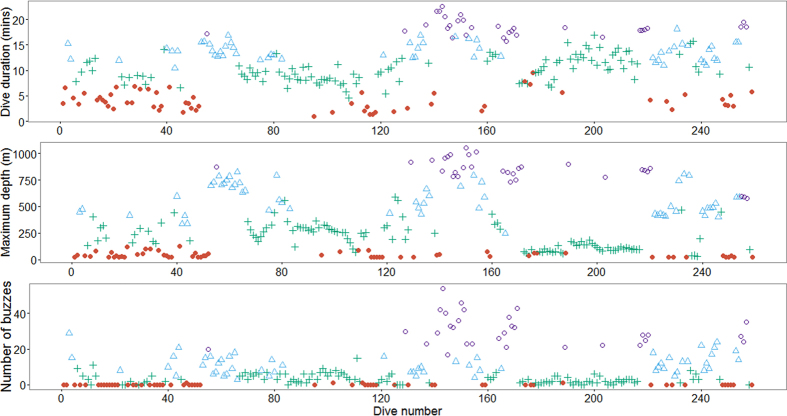
Figure 2. State allocation per dive for each of the three observed variables.
Red filled circles represent state 1; blue triangles represent state 2; green crosses represent state 3 and purple open circles represent state 4. All dives for all individuals are shown sequentially in chronological order along the X-axis.

