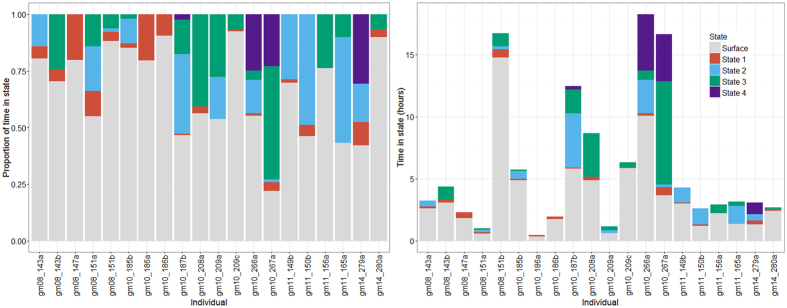
Figure 6. Time budgets for each individual whale.
Left panel shows proportion of time in state. Right panel shows actual time in state for each tag duration. Grey = surface (i.e. data not used in the analysis, including shallow dives classified at surface behaviour (max depth < 20 m)), red = state 1, blue = state 2, green = state 3, purple = state 4.

