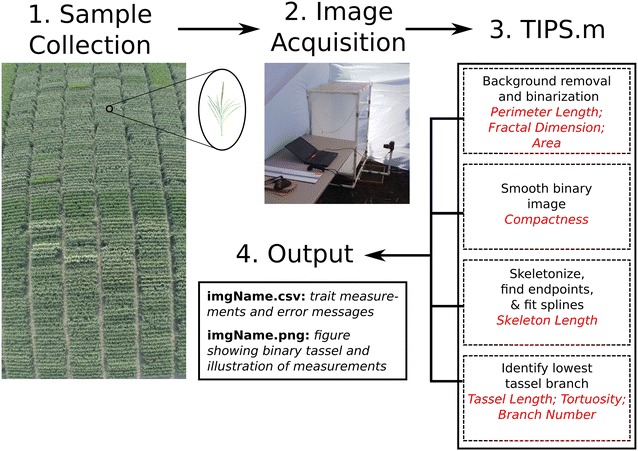
Fig. 2.

TIPS Flowchart. Tassels were collected from replicated field plots (1) and imaged in a PVC photography booth (2) using automated gphoto2 scripts. Image analysis by TIPS software (3) removed background noise, then binarized, smoothed, and skeletonized the tassel. Each analysis step is listed in black type, while the trait measurements resulting from that step are displayed in red type. The trait measurements were returned in a .csv file along with a figure visually showing some of the measurements (4)
